
Preprint, version 1 (November 2026). Not peer reviewed. This is the author’s manuscript, prepared for submission to a peer-reviewed journal. Download: PDF · Word · reproducibility package (zip) · code on GitHub (link added at publication) with code, results and the two independent audits.
Cite as: Kalafatis, P. (2026). How US small businesses’ reported AI use has grown: A three-year time series from the Census Bureau’s Business Trends and Outlook Survey, and its two definitional breaks [Preprint]. x9m8.com.
Peter Kalafatis (ORCID: 0009-0000-1637-7142)
Independent researcher, x9m8.com, New York, NY, USA. Correspondence: x9m8x7@gmail.com
Version 1, November 2026.
Abstract
The US Census Bureau’s Business Trends and Outlook Survey (BTOS) has asked a nationally representative sample of US employer businesses, every two weeks, whether they currently use artificial intelligence (AI), since September 2023. I assembled the full public time series of this question’s national, sector and firm-size estimates, from BTOS’s own live REST API, covering 82 biweekly collection periods from September 11, 2023 through November 1, 2026, and describe how reported AI use has grown and how unevenly it is spread by firm size and sector. Reported current AI use rose from 3.7% of businesses in September 2023 to 10.0% by early October 2025, and then, after the underlying question’s wording was broadened in October 2025 from AI used “in producing goods or services” to AI used “in any of its business functions,” to 24.2% by November 2026, with businesses’ own 6-month expectation running 2-4 percentage points higher throughout. The October 2025 wording change coincides with a 7.3-percentage-point level jump that cannot be cleanly separated from real adoption growth, and the single most recent wave (ending November 1, 2026) renamed the underlying concept again, from “Artificial Intelligence (AI)” to “Super Intelligence (SI),” without, on current evidence, changing its scope. Reported use rises steeply with firm size, from 22.8% of businesses with 1-4 employees to 44.1% of businesses with 250 or more employees in the latest wave, a gap that has widened rather than narrowed since the October 2025 break (13.5 percentage points in November 2025 versus 21.3 points in November 2026). Accommodation and Food Services, the sector that includes restaurants, reports among the lowest AI use of the 18 sectors with published estimates (12.1% in the latest wave, about half the all-sector rate), though its own use nearly doubled over the one year of post-break data available (8.9% to 12.1%). These are Census’s own published national estimates, not a reanalysis of underlying microdata, and the two definitional breaks mean the series cannot be read as one uninterrupted trend; I report pre- and post-break periods separately rather than fitting a single curve across them.
Keywords: artificial intelligence adoption; small business; Business Trends and Outlook Survey; Census Bureau; AI diffusion; firm size
Social media summary: US small-business AI use quadrupled in three years per Census data, but a 2025 survey-question change makes the jump hard to read cleanly.
1. Introduction
Whether and how fast small businesses are adopting artificial intelligence is a question with no settled answer, mostly because it has been hard to measure at all: AI adoption surveys have tended to be one-off, vendor-run, or focused on large firms and knowledge-work sectors. The Census Bureau’s Business Trends and Outlook Survey (BTOS), an experimental, high-frequency survey of roughly 1.2 million US employer businesses launched in 2022 to track business conditions in near-real time, added a direct AI-use question in September 2023 and has repeated it in every biweekly collection wave since (Bonney et al., 2024). Unlike a single cross-sectional supplement, this gives a genuine multi-year time series: as of this writing, 82 biweekly waves, spanning the period before large language model adoption accelerated in US business through late 2026.
Census Bureau staff have already published two analyses from this program. Bonney et al. (2024) reported the first five months of the core AI-use question, finding adoption at 3.7% in September 2023 rising to about 5.4% by February 2024. Bonney et al. (2026), a largely overlapping but not identical author team, used a much richer, purpose-built “AI supplement” fielded November 2025-January 2026 to study which business functions and worker tasks firms use AI for, finding about 18% of firms using AI in at least one function (32% on an employment-weighted basis) and documenting a strong size and sector gradient. Both are valuable, but neither builds the time series across the full run of waves, and neither was positioned to notice, or needed to address, two things that happened to the underlying question between those two snapshots and since: its wording was broadened in October 2025, and it was renamed again in the most recent wave available. This paper’s contribution is narrower than either: I assemble the complete public national, sector and firm-size time series end to end, document both definitional breaks explicitly rather than smoothing over them, and give particular attention to the smallest firms and to Accommodation and Food Services, a sector not singled out in the prior Census or Federal Reserve write-ups on this program (Board of Governors of the Federal Reserve System, 2026) but relevant to this outlet’s own small-business and restaurant-industry readership.
I am not aware of a prior paper that assembles this full multi-year BTOS AI series with an explicit treatment of both the October 2025 wording change and the November 2026 renaming; an independent, non-peer-reviewed chart by Poleg (2026) flags the October 2025 break informally (“the jump across definitions should not be interpreted as pure adoption growth”) but does not build or analyze the series by sector, firm size, or over its full length. I state this as a hedge rather than a strong novelty claim, since Census’s own working-paper program on this survey is active and a more complete analysis may exist that I did not find.
2. Methods
2.1 Data source
BTOS surveys US employer businesses (single- and multi-location, excluding farms) in six rotating panels of about 200,000 businesses each; each sampled business is asked to report roughly once every 12 weeks over a year, and data collection occurs every two weeks (U.S. Census Bureau, n.d.-a). The survey is explicitly labeled “experimental” by the Census Bureau, meaning it has not yet completed the Bureau’s full review process for a standard data product. Two questions, asked from period 31 (September 11-24, 2023) onward, are the subject of this paper: “AI current,” asking whether the business used AI in the last two weeks, and “AI future,” asking whether the business expects to be using AI in six months. I retrieved every published estimate for these two questions, at the national level and broken out by 2-digit NAICS sector and by employment-size class, directly from BTOS’s own public, unauthenticated REST API (U.S. Census Bureau, n.d.-b), on November 11, 2026. The API returns the same underlying estimates BTOS publishes in its downloadable Excel workbooks and interactive visualizations (U.S. Census Bureau, n.d.-c); I used the API because it was directly queryable from this project’s tooling. Full retrieval details, including every endpoint called, are in this paper’s reproducibility package.
2.2 Two definitional breaks in the question
Reading the question text returned by the API for each period (rather than assuming constant wording) revealed two changes. First, from period 85 (October 6-19, 2025) the question’s scope was broadened from asking whether the business used AI “in producing goods or services” to asking whether it used AI “in any of its business functions,” a materially wider concept. No national estimate was published for three biweekly periods (85-87, covering October 6-November 16, 2025) while this change was implemented; the series resumes at period 88 (November 17-30, 2025). Second, in the single most recent period available at the time of this analysis (period 112, October 19-November 1, 2026), the question was renamed again, from “Artificial Intelligence (AI)” to “Super Intelligence or SI (formerly referred to as Artificial Intelligence or AI),” with an updated list of examples; this rename has attracted independent public comment (Willison, 2026), but, on the one wave of data available under the new name, does not appear to have been accompanied by a documented scope change the way the October 2025 break was.
Resolving whether the headline period-112 estimate (24.2%) is actually published under the new wording took a second check, because two public accounts of this rename appear to disagree. Willison (2026), posted November 2, 2026, reports that the instrument wording changed starting with the October 19, 2026 collection (i.e., period 112) but that, as of his post, “the current numbers reflect the old Artificial Intelligence survey wording” and that “the first survey results reflecting the Super Intelligence wording are due for publication on Thursday.” Read on its own, that could mean the 24.2% figure I use throughout this paper is still an AI-wording number. I checked this directly against BTOS’s own live site rather than taking either account on faith: as of this paper’s data pull (November 11, 2026), BTOS’s own interactive dashboard (U.S. Census Bureau, n.d.-d) labels its sector, firm-size and state breakdowns “SI (formerly AI) Use,” with “Data as of November 01, 2026” (i.e., period 112) and an explicit note, “Question wording has changed over time. Please see the About the Data page for more information,” and the API’s own question-text record for period 112 (used throughout this paper) carries the same “Super Intelligence or SI” wording tied directly to that period’s published estimate row. The two accounts are not actually in conflict: Willison’s post predates the publication he was describing. BTOS publishes on a biweekly Thursday schedule, and the “Thursday” his post flags as when SI-wording results were “due” was after his November 2 post, consistent with the dashboard’s own November 2026 update showing the rename already applied to the period-112 data by the time I retrieved it on November 11. I therefore treat the 24.2% headline figure as a published SI-wording estimate, on the direct evidence of BTOS’s own current site, not on Willison’s post alone, while still flagging (per the paragraph above) that only this one wave exists under the new name.
Because only one wave exists under the “SI” wording, I cannot assess whether the rename itself changed how businesses answered; I flag it and do not treat it as a third trend break requiring a split in the main series.
I refer to these as the “pre-break” period (periods 31-84, September 2023-early October 2025, all asking about AI “in producing goods or services”) and the “post-break” period (periods 88-112, mid-November 2025-November 2026, asking about AI “in any business function,” under the name “AI” through period 111 and “SI” at period 112). I analyze and report them separately rather than fitting one trend line across the gap.
2.3 Measures and firm-size/sector breakdowns
For the national series I report the published “AI current” and “AI future” percentage-of-businesses estimates and their published standard errors, for all 82 periods with a national estimate. For sector and firm size, I report BTOS’s own published cross-sectional breakdowns (2-digit NAICS sector, 7-bin employment-size class: 1-4, 5-9, 10-19, 20-49, 50-99, 100-249, 250+ employees) at three periods: 88 (the first post-break period with published data), 100 (roughly the post-break midpoint), and 112 (the latest available). For Accommodation and Food Services (NAICS 72) and for the smallest (1-4 employees) and largest (250+ employees) firm-size bins, I additionally pulled every post-break period (88-112) to build within-era time series. All percentages and standard errors are used exactly as BTOS publishes them; I perform no re-estimation, smoothing, seasonal adjustment or modelling of any kind, consistent with the descriptive approach used elsewhere in this series. A small number of sector cells (e.g., Agriculture, Management of Companies) are blank in BTOS’s own published tables in some periods, which I treat as “not published for this cell/period” rather than imputing a value.
2.4 Software, data and AI use
Analysis used Python 3.13 (csv, json, standard library only) and matplotlib for figures. The study was carried out with the assistance of Claude (Anthropic; this build ran on a Sonnet-family model per the project’s November 2026 cost-saving policy for builder agents, not Opus) in November 2026, which retrieved the BTOS API data and documentation pages in a sandboxed browser, confirmed the question-wording history directly against the API’s own question-text records, wrote and ran the analysis code, verified the cited working papers and notes against their live source pages, and drafted the text under the author’s direction. The author reviewed the work and takes full responsibility for it. Independent audits of the numbers and of the cited sources are planned separately and are not reflected in this version.
3. Results
3.1 The national trend, and the break it crosses
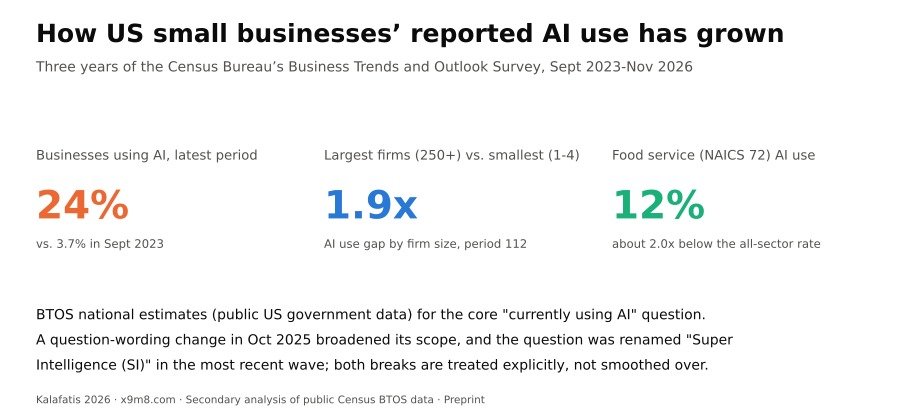
Reported current AI use rose from 3.7% of businesses in the first wave (September 11-24, 2023) to 10.0% by the last pre-break wave (September 22-October 5, 2025), a 2.7-fold rise over 54 biweekly periods under the “producing goods or services” wording (Table 1, Figure 1). Businesses’ 6-month-ahead expectation ran consistently 2-4 percentage points above current use across this period, from 6.3% to 14.0%. After the October 2025 wording broadened to “any of its business functions,” and following a three-period gap with no published national estimate, the first post-break wave (November 17-30, 2025) showed 17.3% current use, a 7.3-percentage-point jump from the last pre-break figure. Reported use then kept rising through the post-break era, reaching 24.2% by the latest available wave (October 19-November 1, 2026), a further 1.4-fold rise over 25 biweekly periods. The 6-month expectation reached 27.6% in the same wave. Because the level jump at the break coincides exactly with the scope-widening in the question text, it cannot be attributed to adoption growth alone, and I treat the pre- and post-break periods as two series rather than one continuous trend (see Limitations).
Table 1. National AI-use estimates, selected BTOS periods, 2023-2026. “Currently using AI” asks about the last two weeks; “Expect to use AI” asks about the next six months. Periods 85-87 (October-November 2025) have no published national estimate; see Methods.
| Period | Date range | Currently using AI (%) | SE | Expect to use AI, 6 mo (%) | SE |
|---|---|---|---|---|---|
| 31 | 9/11/2023 – 9/24/2023 | 3.7 | 0.11 | 6.3 | 0.14 |
| 36 | 11/20/2023 – 12/3/2023 | 4.6 | 0.11 | 7.3 | 0.15 |
| 48 | 5/6/2024 – 5/19/2024 | 4.8 | 0.09 | 6.9 | 0.14 |
| 60 | 10/21/2024 – 11/3/2024 | 6.0 | 0.13 | 9.3 | 0.19 |
| 72 | 4/7/2025 – 4/20/2025 | 8.3 | 0.19 | 10.9 | 0.30 |
| 84 | 9/22/2025 – 10/5/2025 | 10.0 | 0.22 | 14.0 | 0.28 |
| 88 | 11/17/2025 – 11/30/2025 | 17.3 | 0.18 | 21.1 | 0.26 |
| 96 | 3/9/2026 – 3/22/2026 | 18.9 | 0.32 | 22.3 | 0.31 |
| 100 | 5/4/2026 – 5/17/2026 | 19.5 | 0.24 | 22.7 | 0.34 |
| 104 | 6/29/2026 – 7/12/2026 | 21.7 | 0.31 | 24.5 | 0.33 |
| 108 | 8/24/2026 – 9/6/2026 | 23.2 | 0.28 | 27.3 | 0.28 |
| 111 | 10/5/2026 – 10/18/2026 | 24.6 | 0.27 | 28.6 | 0.21 |
| 112 | 10/19/2026 – 11/1/2026 | 24.2 | 0.61 | 27.6 | 0.49 |
Full 82-period series is in data/raw/national_ai_timeseries.csv.

3.2 A sharp, and in the latest period slightly widening, firm-size gradient
AI use rose monotonically with firm size in every period examined. In the latest wave, 22.8% of businesses with 1-4 employees reported current AI use, rising through each size band to 44.1% of businesses with 250 or more employees (Table 3, Figure 3A), a 1.9-fold gap. The gap was present from the first post-break wave (17.0% vs. 30.5%, a 1.8-fold, 13.5-percentage-point difference) and had widened in absolute terms by the latest wave (22.8% vs. 44.1%, a 21.3-percentage-point difference), even as the smallest firms’ own reported use grew substantially (Figure 3B). Both size bins’ series are noisier period to period than the national aggregate, especially the 250+ bin, which BTOS estimates from a smaller pool of large businesses; the widening gap should be read as directional rather than as a precise, stable estimate of the gap’s growth rate.
Table 3. AI use by firm size, period 112 (October 19-November 1, 2026).
| Firm size | Share using AI (%) | SE |
|---|---|---|
| 1-4 employees | 22.8 | 0.86 |
| 5-9 employees | 23.4 | 0.55 |
| 10-19 employees | 25.3 | 0.65 |
| 20-49 employees | 29.2 | 1.11 |
| 50-99 employees | 33.2 | 2.14 |
| 100-249 employees | 40.0 | 2.07 |
| 250+ employees | 44.1 | 1.60 |

3.3 Sector differences, and food service specifically
In the latest wave, AI use ranged from 45.0% of businesses in Information to 10.2% in Mining, Quarrying, Oil and Gas across the 18 NAICS2 sectors with a published estimate (Table 2, Figure 2). Information, Professional, Scientific and Technical Services, Educational Services and Finance and Insurance were the four highest-adoption named sectors (39.2-45.0%), consistent with the knowledge-intensive-sector pattern Bonney et al. (2026) report from the richer AI-supplement data. Accommodation and Food Services, the sector that includes restaurants and bars, reported 12.1% current AI use in the latest wave, second-lowest among the 18 named sectors with a published estimate (after Mining, Quarrying, Oil and Gas at 10.2%) and about half the all-sector rate of 24.2%. Food service’s own use nearly doubled over the available post-break period, from 8.9% at the first post-break wave to 12.1% at the latest, a 1.4-fold rise comparable in proportional terms to the national post-break rise, even though its absolute level remains well below the all-sector average throughout (Figure 3B).
Table 2. AI use by sector, period 112 (October 19-November 1, 2026), sorted descending. “Period 88” is the first post-break wave, for comparison.
| Sector (NAICS2) | Share using AI (%) | SE | Share using AI, period 88 (%) |
|---|---|---|---|
| Information (51) | 45.0 | 3.04 | 41.0 |
| Professional, Scientific and Technical Services (54) | 41.6 | 1.34 | 34.7 |
| Educational Services (61) | 39.5 | 3.59 | 31.9 |
| Finance and Insurance (52) | 39.2 | 2.51 | 29.9 |
| Multi-sector or unclassified (XX) | 34.4 | 3.45 | 24.2 |
| Real Estate Rental and Leasing (53) | 28.2 | 1.71 | 21.0 |
| Utilities (22) | 27.5 | 6.87 | 13.1 |
| Health Care and Social Assistance (62) | 24.6 | 1.27 | 18.1 |
| Wholesale Trade (42) | 23.1 | 0.92 | 12.6 |
| Admin, Support, Waste Mgmt and Remediation (56) | 22.2 | 2.33 | 15.3 |
| Arts, Entertainment and Recreation (71) | 22.0 | 1.10 | 18.0 |
| Manufacturing (31) | 21.4 | 1.28 | 12.7 |
| Retail Trade (44) | 19.1 | 0.99 | 12.5 |
| Construction (23) | 17.1 | 1.19 | 7.4 |
| Other Services except Public Admin (81) | 15.7 | 1.13 | 10.2 |
| Transportation and Warehousing (48) | 12.6 | 1.92 | 7.9 |
| Accommodation and Food Services (72) | 12.1 | 0.96 | 8.9 |
| Mining, Quarrying, Oil and Gas (21) | 10.2 | 4.21 | n/a (suppressed) |

4. Discussion
4.1 Growth is real; the size, but not the exact shape, of the recent jump is uncertain
Across both the pre- and post-break eras taken separately, reported AI use among US businesses rose steadily rather than in one sudden jump, consistent with ordinary technology diffusion rather than a single news-driven spike. The level jump sits squarely on a question-wording change that explicitly widened what counts as “using AI,” so the honest reading is that some, but not an identifiable fraction, of the apparent acceleration at that point is a measurement artifact rather than a change in what businesses actually do. Two dates are easy to conflate here and should not be: the instrument itself changed starting with period 85 (October 6-19, 2025), but because of the three-period publication gap described in Methods §2.2, the first published estimate under the new wording did not appear until period 88 (November 17-30, 2025), which is the date an outside observer reading only the published series would see as “the break.” An independent observer tracking the same public data reached the same caution, dating the visible break to when published data resumes in November 2025 rather than to the underlying October 2025 instrument change (Poleg, 2026); that distinction matters for anyone trying to line this series up against another source by date, but does not change the substance of the caution, which is reassuring corroboration of the finding, not an endorsement of any particular split of the jump into “real” and “artifact” components, since neither source has the microdata to make that split.
4.2 Small businesses are adopting, but the gap to large firms is not closing
That large firms use AI more than small ones is not surprising and matches Bonney et al.’s (2026) cross-sectional finding from the richer supplement data. What this time series adds is a direct, if short, look at whether that gap is closing as overall adoption rises: in the one year of comparable post-break data available, it is not; the absolute percentage-point gap between the smallest and largest firms grew rather than shrank, even as the smallest firms’ own usage grew in both absolute and proportional terms. For an outlet whose own audience runs small, owner-operated businesses, the plainest takeaway is that AI use among the smallest firms is real and growing, but is still running behind larger firms by a widening, not narrowing, margin on this measure.
4.3 Food service lags, but is not standing still
Accommodation and Food Services’ comparatively low reported AI use fits a sector built around in-person service and physical food production, where the clearest current AI use cases (drafting text, analyzing documents, coding) apply less directly than in knowledge-work sectors. Its near-doubling over the single year of comparable post-break data, even from a low base, suggests the sector is not simply inert; whether this reflects point-of-sale/ordering AI, kitchen or scheduling tools, or back-office uses like marketing copy and bookkeeping is not something this aggregate sector-level data can distinguish, and would be a natural next step for a researcher with access to the richer AI-supplement microdata Bonney et al. (2026) used.
4.4 Limitations
This is a description of BTOS’s own published national estimates, not a reanalysis of microdata; I cannot decompose the October 2025 level jump into real adoption growth versus definitional broadening, cannot assess whether the November 2026 AI-to-SI rename affected how businesses answered (only one wave exists under the new name), and cannot explain why three biweekly periods (85-87) have no published national estimate at all beyond noting that they coincide with the wording transition. BTOS is an experimental Census product, not yet a finalized, fully reviewed data series, and its own documentation describes ongoing content changes; the two breaks identified here may not be the last. Standard errors on some sector cells, especially for sectors BTOS surveys relatively few businesses in (e.g., Utilities, Management of Companies), are large enough that period-to-period or sector-to-sector differences of a few percentage points should not be over-read; I report the published standard errors in every table precisely so a reader can judge this themselves. Firm-size and sector breakdowns were pulled at three periods rather than every period (except for the two specific series, firm-size extremes and food service, built across every post-break period); a full all-period, all-breakdown dataset would allow a more complete analysis than this paper attempts. Finally, “using AI” is self-reported by survey respondents against BTOS’s own examples, not independently verified or defined by a common technical standard, a limitation inherent to the underlying survey rather than to this paper’s use of it.
5. Conclusion
Over three years of the Census Bureau’s Business Trends and Outlook Survey, US businesses’ reported current AI use rose from 3.7% to 24.2%, a roughly sixfold increase, though the series crosses a real question-wording break in October 2025 that accounts for part of the apparent acceleration and should not be read as a single clean trend. Large firms use AI far more than small ones, and that gap widened rather than narrowed over the most recent year of comparable data. Accommodation and Food Services, the sector that includes restaurants, remains among the lowest-adoption sectors BTOS tracks, at roughly half the all-sector rate, but its own use nearly doubled over the same year, suggesting slow but real movement rather than complete inertia. A fourth definitional change, the November 2026 renaming of the underlying concept to “Super Intelligence (SI),” is too new to assess and is a natural subject for a follow-up once more waves accumulate under the new wording.
Related on x9m8
- Regional minimum wages and restaurant employment on Long Island, New York
- Not all eating out: GLP-1 uptake and US restaurant employment by segment, 2019–2025
- Cuts and burns, not falls: nonfatal and fatal injury patterns in US food services, 2016–2024
- Open Questions: a series on what science and law have not settled
Acknowledgements
The author thanks the US Census Bureau for publishing BTOS data and documentation free of charge through its public REST API. Claude (Anthropic) assisted with data retrieval, analysis code, citation verification and drafting in November 2026, as described in §2.4. The author reviewed all outputs and is responsible for the content.
Author contributions
P.K. conceived the study, directed the analysis, and reviewed and approved the manuscript.
Financial support
This research received no specific grant from any funding agency, commercial or not-for-profit sector.
Conflicts of interest
The author operates a restaurant (The Heritage Diner) and a small consumer-goods brand, and builds consumer software applications; none of these businesses sponsor or fund AI tools evaluated or discussed in this paper, and the author declares no financial interest in any AI vendor named or implied by this paper’s data.
Research transparency and reproducibility
All primary data are BTOS national, sector and firm-size estimates, works of the US federal government and in the public domain in the United States (17 U.S.C. §105). This paper’s reproducibility package includes the exact CSV/JSON extracts used (with the BTOS REST API endpoints, retrieval date, and a SHA-256 hash for each file; see results/provenance.md), the question-wording record used to identify the two breaks (data/raw/question_wording_by_period.json), and all analysis/figure code. Code and result files are available in the reproducibility package linked from the article page.
References
Board of Governors of the Federal Reserve System. (2026, April 3). Monitoring AI adoption in the US economy, accessible data [FEDS Notes]. https://www.federalreserve.gov/econres/notes/feds-notes/monitoring-ai-adoption-in-the-u-s-economy-accessible-20260403.htm
Bonney, K., Breaux, C., Buffington, C., Dinlersoz, E., Foster, L., Goldschlag, N., Haltiwanger, J., Kroff, Z., & Savage, K. (2024). Tracking firm use of AI in real time: A snapshot from the Business Trends and Outlook Survey (CES Working Paper 24-16). US Census Bureau, Center for Economic Studies. https://www.census.gov/hfp/btos/downloads/CES-WP-24-16.pdf
Bonney, K., Breaux, C., Dinlersoz, E., Foster, L., Haltiwanger, J., & Pande, A. (2026). The microstructure of AI diffusion: Evidence from firms, business functions, and worker tasks (CES Working Paper CES-WP-26-25). US Census Bureau, Center for Economic Studies. https://www.census.gov/library/working-papers/2026/adrm/CES-WP-26-25.html
Office of the Law Revision Counsel, U.S. House of Representatives. (n.d.). 17 U.S.C. §105 — Subject matter of copyright: United States Government works [as published via the U.S. Government Publishing Office, govinfo.gov]. Retrieved November 11, 2026, from https://www.govinfo.gov/content/pkg/USCODE-2021-title17/html/USCODE-2021-title17-chap1-sec105.htm
Poleg, D. (2026). Firms using AI [Interactive chart, “Old/New”]. Retrieved November 11, 2026, from https://www.drorpoleg.com/charts/btos-ai/
U.S. Census Bureau. (n.d.-a). Business Trends and Outlook Survey (BTOS) data. Retrieved November 11, 2026, from https://www.census.gov/data/experimental-data-products/business-trends-and-outlook-survey.html
U.S. Census Bureau. (n.d.-b). BTOS API reference documentation [PDF]. Retrieved November 11, 2026, from https://www.census.gov/hfp/btos/downloads/BTOS%20API%20Reference%20Documentation.pdf
U.S. Census Bureau. (n.d.-c). Business Trends and Outlook Survey: downloads and documentation. Retrieved November 11, 2026, from https://www.census.gov/hfp/btos/data_downloads
U.S. Census Bureau. (n.d.-d). Business Trends and Outlook Survey: visualizations. Retrieved November 11, 2026, from https://www.census.gov/hfp/btos/data
Willison, S. (2026, November 2). Census Bureau “Super Intelligence” [Blog post]. Simon Willison’s Weblog. https://simonwillison.net/2026/nov/2/census-bureau-super-intelligence