

Preprint, version 1 (October 2026). Not peer reviewed. This is the author’s manuscript, prepared for submission to a peer-reviewed journal. Download: PDF · Word · reproducibility package (zip) · code on GitHub with code, results and the two independent audits.
Cite as: Kalafatis, P. (2026). Regional minimum wages and restaurant employment on Long Island, New York [Preprint]. x9m8.com. https://doi.org/10.5281/zenodo.23953186
Peter Kalafatis
Independent researcher, x9m8.com, New York, NY, USA. Correspondence: x9m8x7@gmail.com
Version 1, October 2026.
Competing interest, stated up front: the author operates The Heritage Diner, a full-service restaurant in Mount Sinai, Suffolk County, New York, which employs minimum-wage and tipped workers and is subject to the wage laws studied here. See Conflicts of interest.
Abstract
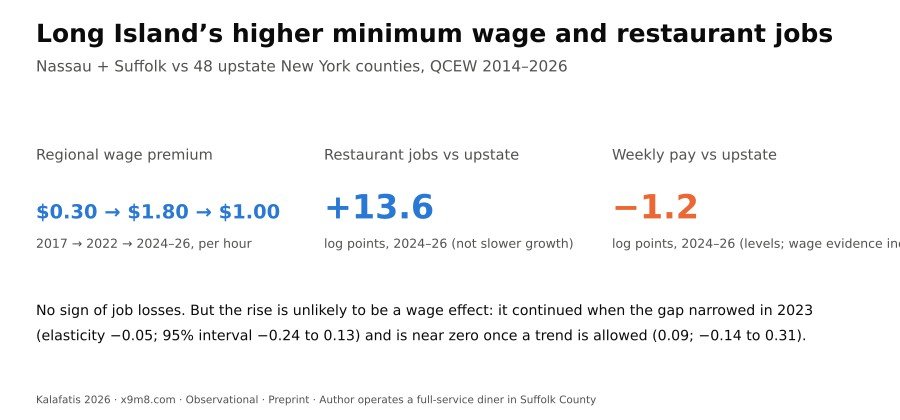
Since 31 December 2016 New York has set a higher minimum wage on Long Island and in Westchester than in the rest of the state outside New York City. The Long Island premium rose from $0.30 to $1.80 an hour by 2022, narrowed to $0.80 in 2023 and has been $1.00 since 2024. I compared restaurant employment, establishments and average weekly wages in Nassau and Suffolk with 42–48 upstate counties, using Quarterly Census of Employment and Wages data for 2014–2026 and inference from 2,000 random splits of the comparison counties. Long Island restaurant employment did not fall relative to upstate; it rose, by 4.1 log points in 2017–2019 and 13.6 in 2024–2026 (95% placebo intervals 1.4 to 6.8 and 5.1 to 21.6). The naive employment elasticity was therefore positive, 1.03 (0.35 to 1.66), but I do not read this as an effect. The relative rise continued when the wage gap narrowed in 2023 (implied elasticity −0.05; −0.24 to 0.13), a linear trend absorbs it (0.09; −0.14 to 0.31), and restaurant establishment counts jumped across New York in the first quarter of 2017, by 8.2% on Long Island and 3.5% upstate, a break absent in Pennsylvania and in total private employment. Average weekly restaurant wages did not rise relative to upstate in levels, but trend-adjusted full-service estimates are positive, so the wage evidence is inconclusive. These data show no sign that the higher Long Island minimum cost restaurant jobs, and they make large negative elasticities unlikely; they cannot exclude small ones.
Keywords: minimum wage; restaurant employment; Long Island; New York; Nassau County; Suffolk County; tipped wage; fast food; QCEW; difference-in-differences; synthetic control; placebo inference
Social media summary: Long Island’s higher minimum wage: restaurant jobs grew faster than upstate, not slower. Not proof of a benefit.
1. Introduction
New York is one of the few US states that sets different minimum wages for different parts of the state. Legislation passed in 2016, amending Labor Law §652, put New York City on the fastest path to $15 an hour, Long Island (Nassau and Suffolk counties) and Westchester County on a slower path, and the rest of the state on a slower one still. From 31 December 2016 the Long Island rate exceeded the upstate rate by $0.30; the gap widened every year to $1.80 in 2022, when Long Island reached $15.00 and the rest of the state $13.20 (New York State Department of Labor [NYSDOL], n.d.-a; New York State Division of the Budget [NYSDOB], 2022). It then narrowed to $0.80 when the upstate rate rose to $14.20 on 31 December 2022, and has been $1.00 since the increases of 2024–2026 ($17.00 against $16.00 in 2026). The Department’s announcement for 2027 is that neither rate will rise in that year (NYSDOL, n.d.-b).
This arrangement is a natural comparison. Long Island and upstate New York share state law, state pandemic rules and the statewide fast-food wage order, but they faced different general minimum wages, and the difference changed in both directions. Restaurants are the industry where the minimum wage bites hardest. If a higher minimum costs restaurant jobs, the effect should appear as slower restaurant employment growth on Long Island than upstate, more so as the gap widened and less so after it narrowed in 2023.
The national evidence on minimum wages and restaurant employment is large and divided. Card and Krueger (1994) compared fast-food restaurants in New Jersey and Pennsylvania after New Jersey raised its minimum in 1992 and found no employment loss. County-pair designs that compare neighbouring counties across state borders found no adverse employment effects in restaurants (Dube et al., 2010), as did county panels that control for county-specific trends in restaurant-and-bar employment (Addison et al., 2012). Neumark et al. (2014) questioned whether such designs isolate reliable identifying variation and reported teen employment elasticities near −0.15. Cengiz et al. (2019) found that the number of low-wage jobs was essentially unchanged in the five years after 138 state increases. A study of Seattle’s increases found reductions in hours worked at low wages (Jardim et al., 2022). Reviews disagree about what the literature says (Manning, 2021; Neumark & Shirley, 2022), although Neumark and Shirley note that the evidence from studies of low-wage industries is less one-sided than for teenagers. Restaurants also adjust in ways other than headcount: through prices (Aaronson, 2001; Allegretto & Reich, 2018; Ashenfelter & Jurajda, 2022) and through exit and entry: Aaronson et al. (2018), using establishment-level QCEW data, found that restaurant exit and entry both rise after increases, and Luca and Luca (2019) studied restaurant exit using Yelp listings.
Two features of restaurant pay matter here. Tipped workers in full-service restaurants may be paid a lower cash wage, with tips making up the rest of the minimum. Studies of tipped-wage policy have reached different conclusions about full-service employment: Even and Macpherson (2014) found that reducing the tip credit lowered employment in full-service restaurants, while Allegretto and Nadler (2015) found small, insignificant effects in their preferred models. And in New York, fast-food chains have had their own wage order since its first increase on 31 December 2015 (NYSDOB, 2022).
For New York specifically, Sabia et al. (2012) reported large negative employment effects of the 2004–2006 state increase on young, less-educated workers, and Hoffman (2016) found no negative effect with the full Current Population Survey. The closest study of the current schedule is a preprint by Ahn (2026), which reports a within-state difference-in-differences analysis of county limited-service restaurant employment in New York across the 2010s and 2020s, finds employment broadly stable, and compares downstate with upstate counties descriptively. The state’s own statutory minimum-wage reports also describe QCEW job trends for New York City, Long Island–Westchester and upstate, including the low-wage sectors, without a causal design (NYSDOB, 2022). Across the state border, Bram et al. (2019) compared New York and Pennsylvania border counties in the QCEW and found that leisure-and-hospitality wages rose faster on the New York side with no discernible employment effect. Baker (2025), in a preprint, compared New York’s January 2025 increase with Texas using monthly state data and found no significant change in food-service employment over a short window.
Relative to this work, the paper adds four things. It estimates the effect of the Long Island–upstate gap itself, using the official quarterly schedule, including the 2023 narrowing of the regional gap, which gives a within-design test that a smooth regional trend cannot pass. It separates full-service from limited-service restaurants, with the tipped cash wage and the fast-food order coded explicitly, and reports establishments and average weekly wages alongside employment. It uses placebo-based inference suited to a single treated region (Conley & Taber, 2011; Ferman & Pinto, 2019) and a synthetic-control check (Abadie et al., 2010). And it documents a break in New York restaurant establishment counts in the first quarter of 2017 that coincides with the start of the regional schedule and would bias a naive comparison. I am not aware of an earlier study of the Long Island schedule that does these things; the search covered Crossref and OpenAlex queries and web searches for grey literature, and may have missed work.
2. Methods
2.1 The minimum-wage schedule
The general minimum wage, the tipped food-service cash wage and the fast-food minimum were coded by quarter from official sources: the New York State Department of Labor history of the minimum wage (NYSDOL, n.d.-a), the Hospitality Industry Wage Order, 12 NYCRR Part 146, §§146-1.2, 146-1.3(b) and 146-3.13(b) (NYSDOL, 2024), and the Department’s summary of Part 146 rates (NYSDOL, 2026), read on 28 October 2026. The first fast-food rate ($9.75 outside New York City from 31 December 2015), which the current Department history does not list, was taken from Table 1 of the Division of the Budget’s 2023 minimum-wage report (NYSDOB, 2022), read on 29 October 2026. Increases dated 31 December were treated as applying from the first quarter of the following year; the fast-food increase of 1 July 2021 from the third quarter of 2021. The general rate was the same statewide before 31 December 2016 ($8.00, $8.75 and $9.00 from 31 December 2013, 2014 and 2015), so the regional gap before 2017 was zero. Table 1 lists the rates.
Three features shape the comparison. First, the tipped food-service cash wage was $7.50 in both regions in 2017 and 2018; the Long Island cash wage first exceeded the upstate one in 2019 ($8.00 against $7.50), and the gap in the cash wage then tracked the general gap in proportional terms (Table 1). Second, the fast-food wage order covers limited-service restaurants that belong to chains of 30 or more establishments nationally (NYSDOL, 2024, §146-3.13(b)). Outside New York City its rate was the same on Long Island and upstate and at or above both regions’ general minimum until 2024 (equal to the Long Island rate in 2022–2023). For chain fast-food workers the regional gap was therefore zero until 2024, when the Long Island general rate ($16.00) overtook the fast-food rate ($15.00). The limited-service industry also contains independent restaurants and small chains not covered by the order, so its exposure lies between zero and the general gap. Third, Pennsylvania kept the federal minimum of $7.25 throughout (U.S. Department of Labor, Wage and Hour Division [USDOL WHD], 2025, 2026).
The treatment variable is the log gap, ln(Long Island rate) − ln(upstate rate). It was 0.030 in 2017, rose to 0.128 in 2022, fell to 0.055 in 2023 and was 0.061–0.065 in 2024–2026.
2.2 Data
Outcomes come from the Quarterly Census of Employment and Wages (QCEW), which counts jobs, establishments and wages reported to state unemployment-insurance programmes (U.S. Bureau of Labor Statistics [BLS], 2026). I used quarterly county files for private ownership, 2014Q1–2026Q1 (the earliest and latest quarters served by the BLS open-data interface on 28 October 2026), for New York and Pennsylvania. Industries were food services and drinking places (NAICS 722), full-service restaurants (722511), limited-service restaurants (722513) and, as a check on the wider local economy, total private employment. Quarterly employment is the average of the three monthly counts; the average weekly wage is total quarterly wages divided by employment and by 13. The wage concept follows state unemployment-insurance reporting; how completely it captures tips is not something I could check. The average weekly wage mixes hourly pay with hours worked.
Long Island is the sum of Nassau and Suffolk counties. The comparison group (“upstate”, or “the rest of the state”) is every county outside New York City, Long Island and Westchester that had employment, establishments and wages disclosed in every one of the 49 quarters for the industry concerned: 48 counties for NAICS 722, 42 each for full-service and limited-service restaurants and 54 for total private employment (Table 2). Nassau and Suffolk were disclosed throughout. Westchester, on the Long Island schedule, was left out of the main analysis and added to the treated region as a robustness check. New York City, on its own schedule, was excluded. Connecticut was not used: from 2024 the QCEW reports Connecticut by planning region rather than county. New Jersey data were extracted but not used, because I could not assemble an official quarterly history of New Jersey rates in the time available.
2.3 Design
For Long Island and for the aggregate of the comparison counties I took the log of each outcome and subtracted its mean for the same quarter of the year over 2014–2016, the three years before the regional schedules began. This removes level differences and seasonality, which matters because Suffolk restaurant employment is strongly seasonal. The difference between the two adjusted series is the quarterly gap path. I summarise it by its mean in 2014–2015 (a lead, which should be near zero), 2017–2019, 2022, 2023 and 2024–2026Q1.
The elasticity of an outcome with respect to the minimum wage was estimated by regressing the quarterly gap path on the log minimum-wage gap with an intercept, over all quarters except 2020 and 2021. The pandemic years were excluded from estimation because restaurant closures and reopening rules, and their timing, could have differed between downstate and upstate counties; they are shown in the figures. I also estimated the elasticity from the 2023 narrowing alone: the change in the outcome gap from 2022 to 2023 divided by the change in the log wage gap (−0.073). A smooth regional trend would bias the main elasticity, because the wage gap rose fairly steadily from 2017 to 2022, but it would not produce a fall in relative employment exactly when the gap narrowed.
Robustness checks were: adding a linear time trend; adding a step dummy from 2017Q1 (to absorb a one-off level break); restricting to 2014–2019; using 2016 alone as the baseline; adding Westchester to the treated region; restricting the comparison counties to those with at least 1,000 jobs in the industry in 2016; using the tipped cash-wage gap for full-service restaurants and the effective fast-food gap for limited-service restaurants; measuring restaurant employment relative to total private employment; and, for wages, dropping comparison counties whose average weekly wage moved by more than 25 log points between consecutive quarters outside 2020–2021. I also fitted a synthetic control for Long Island (Abadie et al., 2010), choosing non-negative weights on the comparison counties summing to one to match Long Island’s adjusted series in 2014–2016. Because those series are demeaned on the same 2014–2016 quarters, the pre-period fit is exact or nearly so by construction, so the usual ratio of post- to pre-period fit is not informative; I rank units by post-period fit alone. Fitting on undemeaned log levels was not feasible, because Long Island’s restaurant employment is larger than any comparison county’s and cannot be matched by a weighted average of them.
As secondary analyses, I estimated county panels of log employment on the log minimum wage with county-by-season and quarter fixed effects: once for Long Island and the upstate counties, and once adding Pennsylvania counties, where the minimum stayed at $7.25 while all of New York’s rose. Standard errors in these panels are clustered by county. Because the minimum wage varies only by region, these understate uncertainty, and the panels are reported for comparison with the literature, not as the main result.
2.4 Inference
With one treated region, conventional clustered standard errors are unreliable (Conley & Taber, 2011; Ferman & Pinto, 2019). I used placebo distributions instead. In the main version, the comparison counties were split at random into two halves 2,000 times (seed 20261028); each half was treated as if it were Long Island and compared with the other half, and every statistic was recomputed. The 95% interval for an estimate is the estimate minus the 97.5th and 2.5th percentiles of the placebo distribution, and the p-value is (1 + the number of placebo estimates at least as large in absolute value) / (1 + the number of placebos), so the smallest possible value is 0.0005. The comparison counties together held 225,439 food-service jobs in 2016, 2.4 times Long Island’s 92,837, so a random half is on average of similar size to Long Island. A more conservative version treats each comparison county in turn as the treated unit; single counties are much smaller and noisier than Long Island, so these intervals are wider than the truth. Newey–West standard errors (four lags) on the quarterly gap regression are reported in the result files for completeness. The minimum detectable effect is 2.8 times the standard deviation of the placebo distribution.
Many outcomes and specifications were examined, and isolated intervals that exclude zero are expected by chance. The analysis was not preregistered.
2.5 Software, data and AI use
Analyses used Python with pandas, NumPy and SciPy; figures used matplotlib. Because the analysis environment had no direct internet access, the QCEW files were fetched in a web browser on data.bls.gov, reduced there to county rows for New York, New Jersey and Pennsylvania, and the Python scripts in the reproducibility package were run unchanged inside the browser with Pyodide 0.26.4 (Python 3.12.1, pandas 2.2.0, NumPy 1.26.4, SciPy 1.12.0). The result files were copied back and checked byte for byte with SHA-256 hashes; figures, tables and derived numbers were produced locally from those files. An equivalent download script for an ordinary computer is included. The minimum-wage schedule was coded by hand from the official documents cited above. All data were retrieved on 28 October 2026. After independent audits, the analysis was rerun in the same way on 29 October 2026 with the corrected schedule and synthetic-control ranking; all other result files were unchanged byte for byte. The study was carried out with the assistance of Claude (Anthropic; model claude-opus-5-5) in October 2026, which retrieved data, wrote and ran the analysis code, searched the literature and drafted the text under the author’s direction. The author reviewed the work and takes full responsibility for it.
3. Results
3.1 Levels
In 2016 Long Island had 92,837 jobs in food services and drinking places, 29.2% of the Long Island plus comparison total. Between 2016 and 2025 those jobs rose 9.4% on Long Island and fell 4.6% in the comparison counties (Table 2). The contrast was largest in full-service restaurants (+2.9% against −13.0%). Long Island restaurant wages were higher throughout: the average weekly wage in full-service restaurants was $483 against $368 in 2016 and $729 against $572 in 2025. Total private employment grew 4.0% on Long Island and 1.2% upstate over the same period.
Table 1. Minimum hourly rates in force for most of each year (dollars). General rates, fast-food rates and tipped food-service cash wages from the New York State Department of Labor, 12 NYCRR Part 146 and NYSDOB (2022); increases dated 31 December apply from the following year. Fast-food rate: chains of 30 or more establishments nationally (§146-3.13(b)), outside New York City; the effective rate is the higher of the fast-food and general rates. The log gap is ln(Long Island rate) − ln(rest-of-state rate). 2026: first quarter only in the data. Pennsylvania: $7.25 throughout.
| Year | LI & Westchester | Rest of state | Gap ($) | Log gap | Tipped cash wage, LI | Tipped cash wage, rest of state | Fast food, LI (effective) | Fast food, rest of state |
|---|---|---|---|---|---|---|---|---|
| 2014 | 8.00 | 8.00 | 0.00 | 0.000 | — | — | 8.00 | 8.00 |
| 2015 | 8.75 | 8.75 | 0.00 | 0.000 | — | — | 8.75 | 8.75 |
| 2016 | 9.00 | 9.00 | 0.00 | 0.000 | — | — | 9.75 | 9.75 |
| 2017 | 10.00 | 9.70 | 0.30 | 0.030 | 7.50 | 7.50 | 10.75 | 10.75 |
| 2018 | 11.00 | 10.40 | 0.60 | 0.056 | 7.50 | 7.50 | 11.75 | 11.75 |
| 2019 | 12.00 | 11.10 | 0.90 | 0.078 | 8.00 | 7.50 | 12.75 | 12.75 |
| 2020 | 13.00 | 11.80 | 1.20 | 0.097 | 8.65 | 7.85 | 13.75 | 13.75 |
| 2021 | 14.00 | 12.50 | 1.50 | 0.113 | 9.35 | 8.35 | 15.00 | 15.00 |
| 2022 | 15.00 | 13.20 | 1.80 | 0.128 | 10.00 | 8.80 | 15.00 | 15.00 |
| 2023 | 15.00 | 14.20 | 0.80 | 0.055 | 10.00 | 9.45 | 15.00 | 15.00 |
| 2024 | 16.00 | 15.00 | 1.00 | 0.065 | 10.65 | 10.00 | 16.00 | 15.00 |
| 2025 | 16.50 | 15.50 | 1.00 | 0.062 | 11.00 | 10.35 | 16.50 | 15.50 |
| 2026 | 17.00 | 16.00 | 1.00 | 0.061 | 11.35 | 10.70 | 17.00 | 16.00 |
— Tipped food-service cash wage before 31 December 2016 not tabulated; it was the same statewide, so the regional gap was zero. Fast food 2016: $9.75 outside New York City from 31 December 2015 (NYSDOB, 2022, Table 1). Fast food 2021: $14.50 until 30 June, $15.00 from 1 July (the table shows the later rate).
Table 2. Analysis sample. Long Island = Nassau and Suffolk counties. Comparison = counties outside New York City, Long Island and Westchester with employment, establishments and wages disclosed by the QCEW in all 49 quarters, 2014Q1–2026Q1. Annual averages of quarterly values; average weekly wage = total wages / employment / 13.
| Industry | Comparison counties | Employment 2016, LI / comparison | Employment change 2016–2025, LI / comparison | Average weekly wage 2016, LI / comparison | Average weekly wage 2025, LI / comparison |
|---|---|---|---|---|---|
| All food services and drinking places (722) | 48 | 92,837 / 225,439 | +9.4% / −4.6% | $432 / $341 | $661 / $526 |
| Full-service restaurants (722511) | 42 | 46,395 / 103,683 | +2.9% / −13.0% | $483 / $368 | $729 / $572 |
| Limited-service restaurants (722513) | 42 | 25,647 / 69,350 | +16.6% / +1.6% | $347 / $307 | $558 / $474 |
| Total private employment (all industries) | 54 | 1,094,011 / 2,540,435 | +4.0% / +1.2% | $1,085 / $864 | $1,493 / $1,244 |

3.2 Gap paths
Before 2017 the Long Island and upstate restaurant series moved together; the 2014–2015 leads were within 0.7 log points of zero for every restaurant outcome (Table 3). From 2017, Long Island restaurant employment rose relative to upstate (Figure 2). For all food services and drinking places the gap averaged 4.1 log points in 2017–2019 (95% placebo interval 1.4 to 6.8), 10.8 in 2022 and 13.6 in 2024–2026Q1 (5.1 to 21.6). The pattern was similar for full-service restaurants (3.9 in 2017–2019; 16.6 in 2024–2026Q1) and limited-service restaurants (7.3; 14.5). All of these intervals exclude zero under the random-halves placebo. Establishment counts followed the same course. Total private employment drifted up more slowly, by 0.9 log points in 2017–2019 and 3.0 in 2024–2026Q1, with intervals that include zero.
In levels, average weekly wages did not show the relative rise one would expect if the higher Long Island minimum had raised pay. For all food services the gap was −0.2 log points in 2017–2019 (−2.7 to 2.1) and −1.2 in 2024–2026Q1 (−4.7 to 2.3). In full-service restaurants it turned negative, −3.6 log points in 2024–2026Q1 (−6.1 to −1.1). The limited-service wage series was dominated by noise in the comparison group, mainly a spike in Erie County’s average weekly wage in early 2016, inside the baseline period; its intervals span about ±10 log points (Figure 2). These level comparisons are not the whole story, because the wage series trended before 2017 (§3.3): the full-service gap was already falling by 0.94 log points a year in 2014–2016 (placebo p = 0.0005), so much of the −3.6 continues that pre-trend, and once trends are allowed for, the full-service wage estimates turn positive. The wage evidence is therefore inconclusive.

Table 3. Long Island minus rest of state: mean log difference relative to the 2014–2016 same-quarter baseline, in log points (×100; for example, 13.6 log points ≈ 14.5%), by period, and the elasticity of the outcome with respect to the minimum wage. 95% intervals in parentheses from 2,000 random half-splits of the comparison counties (placebo distribution); p = (1 + placebos at least as large in absolute value)/(1 + 2,000). Elasticity: regression of the quarterly Long Island minus rest-of-state log difference on the log minimum-wage gap, 2014Q1–2026Q1 excluding 2020–2021. 2023 narrowing: change in the outcome difference from 2022 to 2023 divided by the change in the log wage gap (−0.073). Jobs = employment; Estab. = establishments; Wage = average weekly wage.
| Industry | Outcome | 2014–2015 (lead) | 2017–2019 | 2022 | 2023 | 2024–2026Q1 | Elasticity | p | Elasticity from 2023 narrowing |
|---|---|---|---|---|---|---|---|---|---|
| 722 all | Jobs | −0.2 (−0.6 to 0.2) | 4.1 (1.4 to 6.8) | 10.8 (3.3 to 17.8) | 11.2 (3.1 to 18.4) | 13.6 (5.1 to 21.6) | 1.03 (0.35 to 1.66) | <0.001 | −0.05 (−0.24 to 0.13) |
| Estab. | −0.3 (−0.7 to 0.2) | 6.6 (4.4 to 9.0) | 10.6 (6.1 to 14.9) | 11.0 (6.2 to 16.0) | 13.0 (7.4 to 18.7) | 1.05 (0.62 to 1.46) | <0.001 | −0.06 (−0.23 to 0.11) | |
| Wage | 0.2 (−0.2 to 0.6) | −0.2 (−2.7 to 2.1) | −0.2 (−3.6 to 3.2) | −2.4 (−6.0 to 1.1) | −1.2 (−4.7 to 2.3) | −0.02 (−0.36 to 0.32) | 1.000 | 0.31 (0.13 to 0.50) | |
| 722511 full-service | Jobs | −0.4 (−1.0 to 0.3) | 3.9 (0.2 to 7.6) | 15.7 (7.6 to 24.3) | 14.3 (5.4 to 23.7) | 16.6 (7.5 to 26.3) | 1.39 (0.67 to 2.16) | <0.001 | 0.19 (−0.07 to 0.44) |
| Estab. | −0.7 (−1.4 to 0.1) | 6.5 (3.2 to 9.9) | 14.1 (7.1 to 21.3) | 13.6 (6.1 to 21.6) | 16.1 (8.0 to 24.9) | 1.32 (0.70 to 2.00) | <0.001 | 0.07 (−0.17 to 0.32) | |
| Wage | 0.4 (0.1 to 0.7) | −0.8 (−2.0 to 0.4) | 0.3 (−1.9 to 2.4) | −1.8 (−4.0 to 0.3) | −3.6 (−6.1 to −1.1) | −0.06 (−0.25 to 0.13) | 0.578 | 0.28 (0.15 to 0.42) | |
| 722513 limited-service | Jobs | −0.5 (−1.3 to 0.4) | 7.3 (4.2 to 10.4) | 12.3 (6.1 to 18.8) | 15.1 (8.0 to 22.8) | 14.5 (7.2 to 22.5) | 1.24 (0.66 to 1.86) | <0.001 | −0.38 (−0.74 to −0.03) |
| Estab. | −0.1 (−0.8 to 0.4) | 8.2 (5.1 to 11.4) | 11.6 (6.3 to 17.0) | 13.2 (7.0 to 19.4) | 13.3 (6.9 to 20.1) | 1.15 (0.65 to 1.66) | <0.001 | −0.21 (−0.51 to 0.09) | |
| Wage | 0.6 (−0.4 to 1.5) | 2.2 (−6.5 to 10.9) | 3.5 (−7.7 to 15.0) | 1.3 (−10.0 to 12.6) | 3.6 (−8.9 to 16.2) | 0.36 (−0.85 to 1.57) | 1.000 | 0.31 (0.14 to 0.48) | |
| Total private | Jobs | −0.2 (−0.5 to 0.1) | 0.9 (−0.7 to 2.6) | 2.3 (−1.4 to 6.2) | 2.3 (−1.9 to 6.6) | 3.0 (−1.6 to 7.7) | 0.21 (−0.16 to 0.58) | 0.289 | 0.004 (−0.11 to 0.11) |
| Estab. | −0.2 (−0.5 to 0.2) | 1.4 (−0.2 to 2.9) | 1.9 (−1.9 to 5.8) | 1.3 (−3.1 to 5.9) | 1.7 (−3.5 to 7.0) | 0.18 (−0.19 to 0.57) | 0.415 | 0.08 (−0.04 to 0.19) | |
| Wage | −0.6 (−1.1 to −0.1) | −0.4 (−2.4 to 1.6) | −1.9 (−5.8 to 1.7) | −3.9 (−7.9 to −0.0) | −2.8 (−6.6 to 1.1) | −0.21 (−0.56 to 0.12) | 0.269 | 0.27 (0.10 to 0.44) |
3.3 Elasticities
Regressing the gap paths on the log wage gap gives positive employment elasticities: 1.03 for all food services (0.35 to 1.66), 1.39 for full-service (0.67 to 2.16) and 1.24 for limited-service restaurants (0.66 to 1.86) (Table 3). Taken at face value these would say that a 10% higher minimum wage raised restaurant employment by 10–14%. The minimum detectable elasticity for all food services was 1.00 in this specification, 0.33 with a linear trend and 0.26 from the 2023 narrowing alone. Elasticities for average weekly wages were close to zero: −0.02 (−0.36 to 0.32) for all food services and −0.06 (−0.25 to 0.13) for full-service restaurants.
Three checks indicate that these positive employment elasticities reflect something other than the minimum wage (Table 4; Figure 3a).
First, the 2023 narrowing. When the upstate rate rose to $14.20 and the Long Island rate stayed at $15.00, the log gap fell by 0.073. Relative Long Island restaurant employment did not fall back: its change from 2022 to 2023 was 0.4 log points (−0.9 to 1.7), which implies an elasticity of −0.05 (−0.24 to 0.13) for all food services. For full-service restaurants the implied elasticity was 0.19 (−0.07 to 0.44), and for limited-service restaurants −0.38 (−0.74 to −0.03), because their relative employment rose as the gap narrowed. The relative average weekly wage did fall in 2023, by 2.3 log points in all food services (−3.6 to −0.9), but total private wages fell by almost as much (−2.0; −3.2 to −0.7), so this was not specific to restaurants.
Second, trends. With a linear time trend added, the employment elasticity for all food services fell to 0.09 (−0.14 to 0.31); for full-service restaurants it was 0.24 (−0.16 to 0.63) and for limited-service restaurants 0.35 (−0.003 to 0.69). The pre-period slopes were small and not distinguishable from the placebo distribution for employment (0.5 log points a year for all food services; placebo p = 0.22), but the pre-period has only 12 quarters, and the full-service establishment series did trend before 2017 (placebo p = 0.008). Wage series also trended before 2017: by −0.94 log points a year for full-service restaurants (placebo p = 0.0005), −0.66 for all food services (p = 0.09) and +0.74 for total private employment (p = 0.005).
Third, a break in the establishment counts (Figure 3b). Between the fourth quarter of 2016 and the first quarter of 2017, the number of food-service establishments rose 12.0% in New York City, 8.2% on Long Island, 5.9% in Westchester and 3.5% in the upstate comparison counties. In other years the same seasonal change was close to zero (medians between −0.4% and 0.3%). In Pennsylvania it was 0.2% in 2017, and total private establishments in New York showed no jump. The sizes line up with the minimum-wage increases of 31 December 2016 (22.2% in New York City for large employers, 11.1% on Long Island and in Westchester, 7.8% upstate, none in Pennsylvania). Restaurant employment moved much less: the fourth-to-first-quarter fall in 2017 was 1.5 percentage points smaller than the median on Long Island and 0.8 points smaller upstate. A rise of this size in a single quarter, confined to New York restaurants and not matched by jobs, looks like a change in how establishments were reported rather than a wave of openings; one possibility is that employers began to report restaurant worksites separately once pay depended on the worksite’s region, but I have not been able to confirm the cause. Whatever its origin, it inflates the 2017 step in the Long Island gap. Adding a 2017Q1 step dummy reduced the employment elasticity for all food services to 0.50 (0.04 to 0.96); it remained 0.99 (0.56 to 1.45) for full-service restaurants.
The other checks changed little (Table 4). Adding Westchester, restricting to larger comparison counties, using a 2016-only baseline, or using the tipped cash-wage gap or the effective fast-food gap left the employment elasticities between 0.84 and 1.44. Expressing restaurant employment relative to total private employment gave 0.83 for all food services (0.28 to 1.34). Restricting to 2014–2019 gave 0.70 (0.23 to 1.16). The single-county placebos, which overstate noise, gave intervals that include zero for every restaurant outcome (all food services: −0.76 to 2.11). The synthetic control reproduced the rise in relative employment (mean gap 3.9 log points in 2017–2019 and 12.7 in 2024–2026 for all food services), and its elasticity was 0.90 (−0.48 to 2.24) against in-space placebos. Because the pre-period fit is exact by construction (§2.3; 8 of the 49 units, Long Island among them, had a pre-period root-mean-square error below 10⁻⁶), the post-to-pre ratio cannot be used to rank units. Ranked by post-period fit alone, Long Island was 18th of 49, so the synthetic control does not single it out. With weight above 0.01 on 31 of 48 donors, it is close to an equally weighted comparison and adds little to the main design.
For wages, dropping comparison counties with outlying wage movements (two for all food services and for limited-service restaurants, four for full-service) left the all-food-services elasticity at −0.02 (−0.37 to 0.32) and the full-service elasticity at −0.07 (−0.27 to 0.14), and gave −0.21 (−0.39 to −0.01) for limited-service restaurants. Allowing for the pre-existing wage trends changes the full-service result: with a linear trend the full-service wage elasticity was 0.30 (0.16 to 0.44), and with a 2017Q1 step dummy 0.26 (0.10 to 0.42); for all food services the corresponding estimates were 0.17 (−0.08 to 0.41) and 0.15 (−0.10 to 0.41).
Table 4. Robustness of the minimum-wage elasticities for employment and average weekly wages. Estimate (95% placebo interval). Last rows: county panels with county-by-season and quarter fixed effects, log minimum wage as regressor, standard errors clustered by county (normal-approximation intervals; these understate uncertainty because the wage varies only by region). — not applicable.
| Specification | 722 employment | 722511 employment | 722513 employment | 722 wage | 722511 wage | 722513 wage |
|---|---|---|---|---|---|---|
| Main specification | 1.03 (0.35 to 1.66) | 1.39 (0.67 to 2.16) | 1.24 (0.66 to 1.86) | −0.02 (−0.36 to 0.32) | −0.06 (−0.25 to 0.13) | 0.36 (−0.85 to 1.57) |
| Single-county placebos (conservative) | 1.03 (−0.76 to 2.11) | 1.39 (−1.85 to 3.23) | 1.24 (−0.74 to 4.39) | −0.02 (−1.16 to 0.78) | −0.06 (−0.79 to 0.75) | 0.36 (−1.70 to 1.63) |
| Pre-COVID quarters only (2014–2019) | 0.70 (0.23 to 1.16) | 0.72 (0.09 to 1.36) | 1.27 (0.71 to 1.84) | 0.04 (−0.41 to 0.48) | −0.05 (−0.25 to 0.16) | 0.45 (−1.24 to 2.14) |
| Step dummy from 2017Q1 | 0.50 (0.04 to 0.96) | 0.99 (0.56 to 1.45) | 0.46 (−0.02 to 0.97) | 0.15 (−0.10 to 0.41) | 0.26 (0.10 to 0.42) | 0.28 (−0.36 to 0.93) |
| Linear time trend | 0.09 (−0.14 to 0.31) | 0.24 (−0.16 to 0.63) | 0.35 (−0.003 to 0.69) | 0.17 (−0.08 to 0.41) | 0.30 (0.16 to 0.44) | 0.30 (−0.48 to 1.09) |
| Baseline 2016 only | 1.03 (0.35 to 1.66) | 1.39 (0.67 to 2.16) | 1.24 (0.66 to 1.86) | −0.02 (−0.37 to 0.32) | −0.06 (−0.26 to 0.13) | 0.36 (−0.86 to 1.58) |
| Westchester added to treated region | 0.84 (0.16 to 1.47) | 1.03 (0.30 to 1.80) | 1.20 (0.62 to 1.81) | −0.10 (−0.44 to 0.24) | −0.10 (−0.29 to 0.09) | 0.32 (−0.89 to 1.53) |
| Comparison counties with ≥1,000 jobs in 2016 | 1.03 (0.36 to 1.71) | 1.44 (0.65 to 2.23) | 1.18 (0.52 to 1.88) | −0.02 (−0.36 to 0.33) | −0.06 (−0.27 to 0.15) | 0.49 (−0.85 to 1.95) |
| Industry-specific gap (tipped cash wage; effective fast-food rate) | — | 1.43 (0.72 to 2.21) | 1.32 (0.45 to 2.28) | — | −0.04 (−0.25 to 0.15) | 0.34 (−0.75 to 1.45) |
| Employment relative to total private employment | 0.83 (0.28 to 1.34) | 1.20 (0.60 to 1.81) | 1.05 (0.54 to 1.59) | — | — | — |
| Comparison counties with wage outliers dropped | — | — | — | −0.02 (−0.37 to 0.32) | −0.07 (−0.27 to 0.14) | −0.21 (−0.39 to −0.01) |
| Synthetic control (in-space placebos) | 0.90 (−0.48 to 2.24) | 0.97 (−2.35 to 3.51) | 1.99 (−0.72 to 4.55) | −0.12 (−0.94 to 0.75) | −0.07 (−1.09 to 1.04) | −0.10 (−1.38 to 1.51) |
| County panel, Long Island and rest of state | 0.93 (0.48 to 1.37) | 1.11 (0.62 to 1.61) | 1.54 (0.91 to 2.16) | — | — | — |
| County panel, New York (ex. NYC, Westchester) and Pennsylvania | −0.06 (−0.13 to 0.01) | −0.08 (−0.19 to 0.04) | −0.05 (−0.15 to 0.06) | — | — | — |
| … weighted by 2016 employment | −0.03 (−0.14 to 0.08) | −0.05 (−0.19 to 0.10) | −0.004 (−0.11 to 0.11) | — | — | — |
| … 2014–2019 only | −0.04 (−0.13 to 0.06) | −0.06 (−0.20 to 0.08) | −0.02 (−0.18 to 0.14) | — | — | — |

3.4 County panels with Pennsylvania
In the county panel of Long Island and upstate counties, the employment elasticity for all food services was 0.93 (0.48 to 1.37), close to the main estimate. Adding Pennsylvania counties, so that most of the identifying variation comes from New York’s increases against Pennsylvania’s flat $7.25, gave −0.06 (−0.13 to 0.01), −0.08 (−0.19 to 0.04) for full-service and −0.05 (−0.15 to 0.06) for limited-service restaurants; weighting by employment and restricting to 2014–2019 gave similar values (Table 4). These intervals are too narrow, for the reason given in §2.3.
4. Discussion
4.1 What the results show
The first finding is negative in the useful sense. Over nine years in which Long Island’s minimum wage was up to $1.80 an hour above the upstate rate, Long Island restaurant employment, full-service and limited-service alike, grew faster than upstate, not slower. Nothing in these data points to restaurant job losses on Long Island caused by the regional premium. The cleanest within-design test, the 2023 narrowing of the gap, gives an elasticity near zero for all food services, with a 95% interval from −0.24 to 0.13. The trend-adjusted estimate gives −0.14 to 0.31. These intervals are consistent with the near-zero estimates of much of the literature (Dube et al., 2010; Cengiz et al., 2019), and they include modest negative values such as the teen employment elasticities near −0.15 reported by Neumark et al. (2014). They rule out large negative elasticities for Long Island restaurants; they do not rule out small ones.
The second finding is that the positive relative growth should not be read as a benefit of the minimum wage. It began with a reporting break in early 2017, it continued in 2023 when the wage gap narrowed, it is largely absorbed by a linear trend, and total private employment on Long Island drifted up relative to upstate as well. A more plausible reading is that Long Island’s restaurant sector grew faster than upstate’s for reasons unrelated to the wage schedule, among them population and income differences and a stronger post-pandemic recovery downstate; I have not tested these explanations.
The third finding is that the wage evidence is inconclusive. In levels, the QCEW wage data show no relative rise in Long Island restaurant pay. But the full-service wage gap was already falling before 2017, and once a trend or a 2017 step is allowed for, the full-service wage elasticity is positive (0.30 and 0.26) with intervals that exclude zero. If the level comparison is the right reading, two explanations are consistent with Table 2. Long Island restaurant pay was already well above upstate pay: in 2016 the full-service average weekly wage was 31% higher. If most Long Island restaurant workers already earned more than the upstate minimum plus the regional premium, the premium bound for fewer of them than the headline gap suggests. And the average weekly wage mixes hourly pay, hours and reported tips; faster employment growth on Long Island, if it came with more part-time jobs, would hold the average down even if hourly pay rose. Without hourly wage data I cannot separate these, and I cannot tell whether the level or the trend-adjusted reading is right. A design that cannot show clearly that the wage moved is weak evidence on employment either way, and that limits what can be concluded.
For full-service restaurants, the tipped cash wage complicates the picture. The Long Island cash wage first exceeded the upstate one in 2019, and the regional difference in what a full-service employer must pay a tipped server out of pocket was $0.50 to $1.20 an hour. Using that gap instead of the general one changed nothing material (elasticity 1.43; 0.72 to 2.21). The limited-service industry’s exposure was muted until 2024 by the statewide fast-food order, yet its relative employment rose about as much as full-service employment, which is another sign that the relative growth is not driven by the wage gap.
4.2 Relation to earlier work
Ahn (2026) reports broadly stable limited-service employment across New York’s phased increases; the present results agree for Long Island and extend the comparison to the regional gap itself, full-service restaurants, establishments, wages and the post-2022 period. The county panel that adds Pennsylvania produced small negative point estimates with intervals including zero, in line with the near-zero estimates of border-county designs (Dube et al., 2010) and with Bram et al. (2019), who found no discernible employment effect in New York–Pennsylvania border counties; these panels rest on cross-state comparisons with few policy regions and should be weighed lightly. The finding that establishment counts responded to a reporting change, not only to openings and closings, matters for studies of restaurant entry and exit that use administrative establishment counts, such as Aaronson et al. (2018); Luca and Luca (2019) studied exit with Yelp listings and would not be affected.
4.3 Limitations
The treated region is two counties, and every estimate rests on one comparison over time. Placebo inference addresses the small number of treated units but cannot remove a Long Island-specific shock that coincided with the schedule. The random-halves intervals may also be too narrow: each half mixes counties from across upstate New York, so region-wide shocks average out, whereas Long Island is one contiguous suburban economy. The single-county intervals, which are too wide for the opposite reason, include zero for every restaurant outcome, so intervals that exclude zero under the random-halves placebo should not be read as strong evidence. The pre-period is short: the QCEW interface served data only from 2014, so there are 12 quarters before the regional split. COVID-19 dominated 2020 and 2021, and those years were excluded from estimation; their after-effects may have differed between downstate and upstate counties in ways that persist in 2022–2026. The 2017Q1 break in establishment counts affects the establishment results directly and the employment results to a smaller degree; I could not identify its cause. The QCEW measures jobs, not hours or hourly wages, and its average weekly wage cannot show whether hourly pay rose. Comparison counties were limited to those disclosed in every quarter, which drops small rural counties. The limited-service wage series is affected by an outlier in a large comparison county, and the restaurant wage series trended before 2017. Many outcomes and specifications were examined. Finally, the analysis is observational; it identifies the effect of the regional premium only if Long Island restaurant outcomes would otherwise have tracked upstate ones, and the evidence in §3.3 suggests they would not have.
5. Conclusion
Long Island’s higher minimum wage did not coincide with slower restaurant job growth. Restaurant employment and establishments on Long Island grew faster than upstate from 2017 to 2026, in full-service and limited-service restaurants alike. The naive estimate of a positive employment effect does not survive scrutiny: the relative growth continued when the regional wage gap narrowed in 2023, it is absorbed by a trend, and it begins with a break in how New York restaurant establishments were counted. The wage evidence is inconclusive: average weekly wages in Long Island restaurants did not rise relative to upstate in levels, but trend-adjusted full-service estimates are positive. The data rule out large job losses from the regional premium and are consistent with an effect near zero; they cannot detect small effects, and they do not clearly show the wage increase that would make an employment effect likely in the first place.
Related on x9m8
- Drive-thru dose–response: GLP-1 uptake and US restaurant employment, paper 11
- Food swamps and obesity revisited: a reproduction with public data
Acknowledgements
The author thanks the Bureau of Labor Statistics and the New York State Department of Labor for making their data and wage orders public. Claude (Anthropic; model claude-opus-5-5) assisted with data retrieval, analysis code, literature search and drafting in October 2026, as described in §2.5. The author reviewed all outputs and is responsible for the content.
Author contributions
P.K. conceived the study, directed the analysis, and reviewed and approved the manuscript.
Financial support
This research received no specific grant from any funding agency, commercial or not-for-profit sector.
Conflicts of interest
The author operates The Heritage Diner, a full-service restaurant in Mount Sinai, Suffolk County, New York. The diner employs minimum-wage and tipped workers and is subject to the Long Island minimum wage and the hospitality wage order studied here, so the author has a direct commercial interest in how these laws are assessed. The author has no other financial interest in any restaurant business, industry association or advocacy group. The author also owns Marcellino NY, a maker of leather briefcases, which is unrelated to this topic.
Research transparency and reproducibility
All data are public: BLS Quarterly Census of Employment and Wages county files (data.bls.gov), the New York State Department of Labor minimum-wage history and Hospitality Industry Wage Order (dol.ny.gov, forms.labor.ny.gov) and the U.S. Department of Labor state minimum-wage tables (dol.gov). Code, result files, the coded minimum-wage schedule and a list of input and result hashes are in the reproducibility package linked from the article page. The QCEW files are not redistributed and can be downloaded with the package’s fetch script. The analysis was not preregistered.
References
Aaronson, D. (2001). Price pass-through and the minimum wage. Review of Economics and Statistics, 83(1), 158–169. https://doi.org/10.1162/003465301750160126
Aaronson, D., French, E., Sorkin, I., & To, T. (2018). Industry dynamics and the minimum wage: A putty-clay approach. International Economic Review, 59(1), 51–84. https://doi.org/10.1111/iere.12262
Abadie, A., Diamond, A., & Hainmueller, J. (2010). Synthetic control methods for comparative case studies: Estimating the effect of California’s tobacco control program. Journal of the American Statistical Association, 105(490), 493–505. https://doi.org/10.1198/jasa.2009.ap08746
Addison, J. T., Blackburn, M. L., & Cotti, C. D. (2012). The effect of minimum wages on labour market outcomes: County-level estimates from the restaurant-and-bar sector. British Journal of Industrial Relations, 50(3), 412–435. https://doi.org/10.1111/j.1467-8543.2010.00819.x
Ahn, J. (2026). Phased minimum wage increases and fast-food employment: Evidence from New York in the 2010s–2020s [Preprint]. SocArXiv. https://doi.org/10.31235/osf.io/chktv_v1
Allegretto, S., & Nadler, C. (2015). Tipped wage effects on earnings and employment in full-service restaurants. Industrial Relations: A Journal of Economy and Society, 54(4), 622–647. https://doi.org/10.1111/irel.12108
Allegretto, S., & Reich, M. (2018). Are local minimum wages absorbed by price increases? Estimates from internet-based restaurant menus. ILR Review, 71(1), 35–63. https://doi.org/10.1177/0019793917713735
Ashenfelter, O., & Jurajda, Š. (2022). Minimum wages, wages, and price pass-through: The case of McDonald’s restaurants. Journal of Labor Economics, 40(S1), S179–S201. https://doi.org/10.1086/718190
Baker, P. (2025). How minimum wage hikes affect food service employment: Evidence from California and New York [Preprint]. Research Square. https://doi.org/10.21203/rs.3.rs-7889672/v1
Bram, J., Karahan, F., & Moore, B. (2019, September 25). Minimum wage impacts along the New York–Pennsylvania border. Liberty Street Economics. Federal Reserve Bank of New York. https://libertystreeteconomics.newyorkfed.org/2019/09/minimum-wage-impacts-along-the-new-york-pennsylvania-border/
Card, D., & Krueger, A. B. (1994). Minimum wages and employment: A case study of the fast-food industry in New Jersey and Pennsylvania. American Economic Review, 84(4), 772–793. https://www.jstor.org/stable/2118030
Cengiz, D., Dube, A., Lindner, A., & Zipperer, B. (2019). The effect of minimum wages on low-wage jobs. Quarterly Journal of Economics, 134(3), 1405–1454. https://doi.org/10.1093/qje/qjz014
Conley, T. G., & Taber, C. R. (2011). Inference with “difference in differences” with a small number of policy changes. Review of Economics and Statistics, 93(1), 113–125. https://doi.org/10.1162/REST_a_00049
Dube, A., Lester, T. W., & Reich, M. (2010). Minimum wage effects across state borders: Estimates using contiguous counties. Review of Economics and Statistics, 92(4), 945–964. https://doi.org/10.1162/REST_a_00039
Even, W. E., & Macpherson, D. A. (2014). The effect of the tipped minimum wage on employees in the U.S. restaurant industry. Southern Economic Journal, 80(3), 633–655. https://doi.org/10.4284/0038-4038-2012.283
Ferman, B., & Pinto, C. (2019). Inference in differences-in-differences with few treated groups and heteroskedasticity. Review of Economics and Statistics, 101(3), 452–467. https://doi.org/10.1162/rest_a_00759
Hoffman, S. D. (2016). Are the effects of minimum wage increases always small? A reanalysis of Sabia, Burkhauser, and Hansen. ILR Review, 69(2), 295–311. https://doi.org/10.1177/0019793915610558
Jardim, E., Long, M. C., Plotnick, R., van Inwegen, E., Vigdor, J., & Wething, H. (2022). Minimum-wage increases and low-wage employment: Evidence from Seattle. American Economic Journal: Economic Policy, 14(2), 263–314. https://doi.org/10.1257/pol.20180578
Luca, D. L., & Luca, M. (2019). Survival of the fittest: The impact of the minimum wage on firm exit (NBER Working Paper No. 25806). National Bureau of Economic Research. https://doi.org/10.3386/w25806
Manning, A. (2021). The elusive employment effect of the minimum wage. Journal of Economic Perspectives, 35(1), 3–26. https://doi.org/10.1257/jep.35.1.3
Neumark, D., Salas, J. M. I., & Wascher, W. (2014). Revisiting the minimum wage–employment debate: Throwing out the baby with the bathwater? ILR Review, 67(3, Suppl.), 608–648. https://doi.org/10.1177/00197939140670s307
Neumark, D., & Shirley, P. (2022). Myth or measurement: What does the new minimum wage research say about minimum wages and job loss in the United States? Industrial Relations: A Journal of Economy and Society, 61(4), 384–417. https://doi.org/10.1111/irel.12306
New York State Department of Labor. (n.d.-a). History of the minimum wage in New York State. Retrieved October 28, 2026, from https://dol.ny.gov/history-minimum-wage-new-york-state
New York State Department of Labor. (n.d.-b). Minimum wage. Retrieved October 28, 2026, from https://dol.ny.gov/minimum-wage
New York State Department of Labor. (2024). Hospitality industry wage order, 12 NYCRR Part 146 (Form CR 146, 09/24). Retrieved October 28, 2026, from https://forms.labor.ny.gov/WP/CR146.pdf
New York State Department of Labor. (2026). Wage order summary: Hospitality industry (Part 146, rev. 02/26). Retrieved October 28, 2026, from https://forms.labor.ny.gov/WP/Part146.pdf
New York State Division of the Budget. (2022). Report on New York’s minimum wage increases scheduled for 2023 (September 30, 2022). Retrieved October 29, 2026, from https://dol.ny.gov/system/files/documents/2022/10/minimum-wage-2023.pdf
Sabia, J. J., Burkhauser, R. V., & Hansen, B. (2012). Are the effects of minimum wage increases always small? New evidence from a case study of New York State. ILR Review, 65(2), 350–376. https://doi.org/10.1177/001979391206500207
U.S. Bureau of Labor Statistics. (2026). Quarterly Census of Employment and Wages: County quarterly data by industry, 2014Q1–2026Q1 [Data set]. Retrieved October 28, 2026, from https://www.bls.gov/cew/
U.S. Department of Labor, Wage and Hour Division. (2025). Changes in basic minimum wages in non-farm employment under state law: Selected years 1968 to 2024. Retrieved October 28, 2026, from https://www.dol.gov/agencies/whd/state/minimum-wage/history
U.S. Department of Labor, Wage and Hour Division. (2026). State minimum wage laws (updated July 1, 2026). Retrieved October 28, 2026, from https://www.dol.gov/agencies/whd/minimum-wage/state




[…] Regional minimum wages and restaurant employment on Long Island, New York […]
[…] Regional minimum wages and restaurant employment on Long Island, New York […]
[…] wage on Long Island and in Westchester than in the rest of the state outside New York City. The minimum wage and restaurant employment on Long Island preprint tabulates the rates in force for most of each year from 2014 to 2026, and the first tab […]