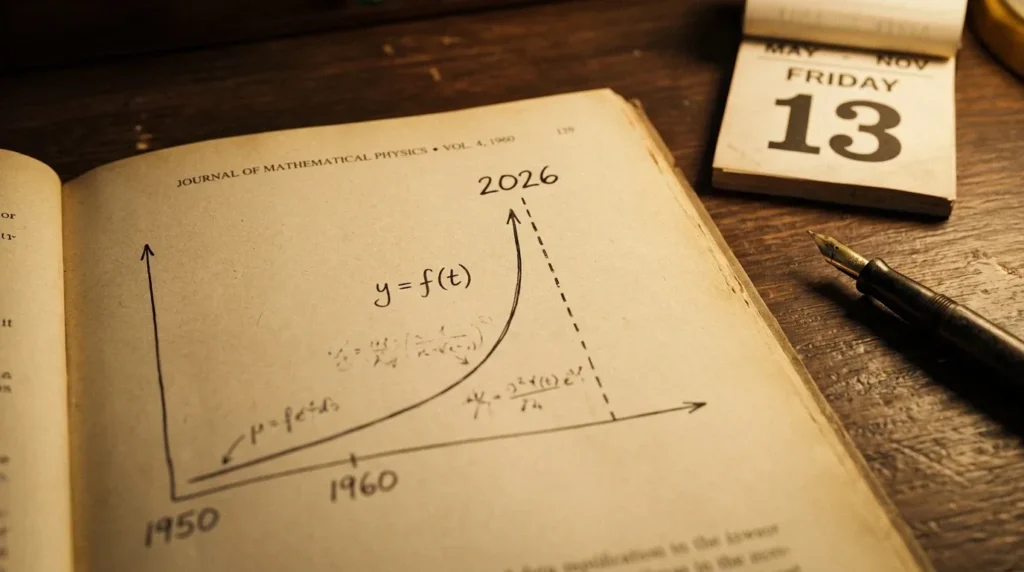
Friday, November 13, 2026, was supposed to be the day humanity ran out of room, and the cause wasn’t war or an asteroid but arithmetic. In November 1960 the journal Science published a paper whose title reads like a dare, “Doomsday: Friday, 13 November, A.D. 2026,” and its lead line said human population would approach infinity on that date if it kept growing the way it had for the past two thousand years.
The date came and went last week, and the planet stayed exactly as crowded as it was on Thursday.
The equation itself deserves more than a shrug. Its forecasts held up better than most demographers’ through the 1970s and 1980s, and the way it finally came apart says more about the past 60 years than about the end of the world.
The paper, and a date with a private joke in it
A physicist, two co-authors and a punchline built into the title.
Heinz von Foerster, Patricia Mora and Lawrence Amiot worked in the department of electrical engineering at the University of Illinois at Urbana. They fit a curve to world population estimates reaching back to the time of Christ. Historian Alan MacEachern of Western University, writing for The Conversation, counts 24 estimates covering 2,000 years. What came out wasn’t an exponential, the steady doubling taught in school. It was steeper: a hyperbola, a curve whose growth itself speeds up until it runs into a vertical wall at a fixed date.
The reasoning was that people aren’t bacteria in a dish. Humans form coalitions, solve problems and push back the limits that stop other animals, so more people bring better tools and better tools make room for more people.
The fitted wall landed at A.D. 2026.87, give or take 5.50 years, which on a calendar is mid-November 2026. The exact day carries a wink. Von Foerster was born in Vienna on November 13, 1911, and according to Sciencing he supposedly chose his own birthday as a joke. Scheduling the end of the world for a 115th birthday is a strange kind of humor, and it sat on top of a serious fit to real data.

Squeezed, not starved
Reporters loved it, and demographers wrote angry letters.
Time covered the paper in 1960 and quoted von Foerster directly: “Our great-great-grandchildren will not starve. They will be squeezed to death.” The authors’ remedy was a social thermostat they called a “peoplo-stat,” a control mechanism to hold population steady, and the paper put a number on it: cut the birth rate to about half its 1960 value.
Mathematicians and demographers answered in the letters pages of Science, calling the work “ridiculous” and “manifestly absurd,” and the authors replied with spirited defenses. Then the paper did something flashy papers rarely manage. MacEachern traces it through genetics, ecology and demography textbooks from the 1960s into the 1980s, where it was often cited at face value, through a 1963 Canadian parliamentary committee, and into a 1971 U.S. Supreme Court abortion case.
Even the text has a sense of humor. Discussing the space-age fantasy of shipping people off the planet, the authors call those emigrants “space-trotters” and regret that “no re-entry permit to earth can be given” to them.
Running the 1960 equation against the real numbers
The original constants, checked year by year.
The paper prints its fitted constants: K = 1.79 × 10¹¹, k = 0.990, and the doomsday year t₀ = 2026.87. Plug any year into N = K ÷ (t₀ − year)^k and the formula returns the world population it expected. x9m8 ran those numbers against Our World in Data’s world population series, which combines HYDE, Gapminder and the UN’s World Population Prospects 2024. The last column uses the far edge of the paper’s own error bar, the most generous reading possible.
| Year | Actual (billions) | 1960 equation (billions) | Equation with t₀ = 2032.37 (billions) |
|---|---|---|---|
| 1960 | 3.02 | 2.79 | 2.58 |
| 1970 | 3.69 | 3.28 | 2.99 |
| 1980 | 4.45 | 3.97 | 3.56 |
| 1990 | 5.33 | 5.03 | 4.39 |
| 2000 | 6.17 | 6.88 | 5.73 |
| 2010 | 7.02 | 10.91 | 8.25 |
| 2020 | 7.89 | 26.56 | 14.84 |
| 2023 | 8.09 | 46.88 | 19.54 |
Through 1990, the real world ran ahead of doomsday. In the year the paper came out, actual population beat the formula by about 8%. Mathematician Brad Willms of Bishop’s University made the same observation at a 2010 meeting: at the halfway mark, 1994, humanity was ahead of schedule.
On this data, 1995 is the first year real population falls below the curve. MacEachern dates the equation’s faltering to around 1993. After the crossover, the two lines don’t drift apart so much as tear: by 2023 the equation wanted almost 47 billion people, and even at the generous edge of its error bar it wanted nearly 20 billion. The planet had about 8.
On January 1, 2026, the formula called for roughly 205 billion people, more than 25 times the real count.

Where the curve broke
The growth rate peaked four years after the paper ran.
Computed from the same Our World in Data series, world population growth peaked in 1964 at about 2.25% a year and had fallen to about 0.88% by 2023, with bumps along the way. A hyperbola needs growth to keep accelerating forever. The real rate topped out almost as soon as the formula hit print, and it has drifted down for six decades since.
Birth rates fell across most of the world. MacEachern notes that today’s global birth rate is slightly less than half the 1960 rate, close to the cut the paper called for, though the paper’s role in getting there can’t be measured.
The authors’ defense
Was it a forecast, or a warning sign at the edge of a cliff?
Calling the equation a failure assumes it was a prediction. Read the way the authors framed it, a description of what happens if growth continues as it has, it works more like a sign posted at a drop-off. A sign like that doesn’t fail when people stop short of the edge.
The defense has a weak spot. Nothing links the paper to what happened next. The fall in birth rates played out over decades, country by country, through choices made at kitchen tables and in clinics, and a paper in Science with a Friday-the-13th title can’t be traced into those choices in any measurable way. Credit for the bend belongs to billions of people, not three engineers in Illinois.
The deeper idea is still alive. In 2026 the journal Cliodynamics published a paper by Andrey Korotayev that borrows the 1960 title outright, “Doomsday: Friday, 13 November, A.D. 2026,” adding a subtitle about demographic-technological positive feedback, hyperbolic acceleration of global complexity growth, and a 21st-century singularity. The feedback loop von Foerster described, more people making better tools that make room for more people, now gets argued less in terms of bodies and more in terms of everything else that might be speeding up.
MacEachern sums up the paper’s method this way: drawing the world’s attention “to a serious matter by way of absurdity—that’s a good trick.”
After the deadline
What remains is a slow-growing world and a bigger argument.
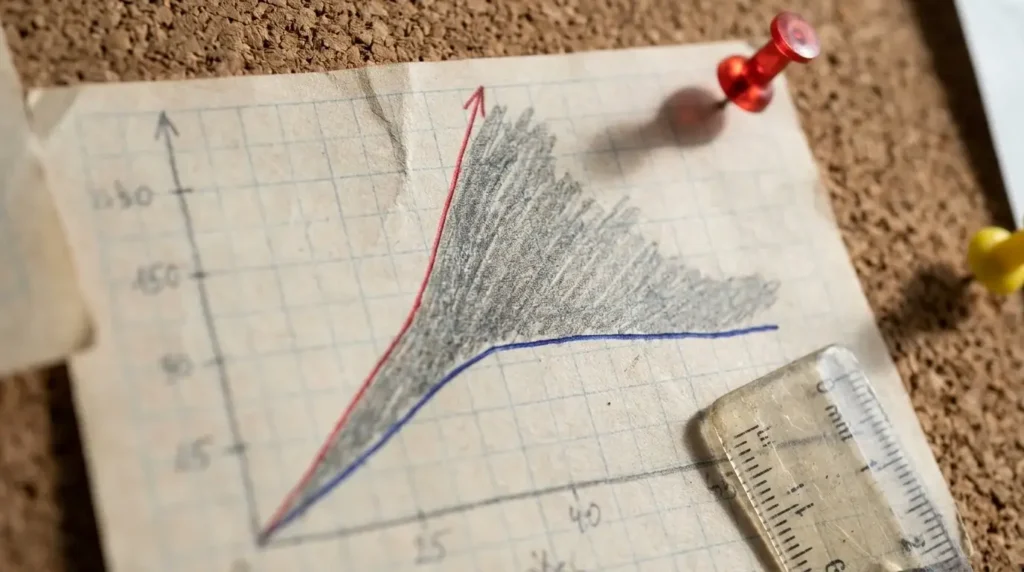
Just before its wall, the formula was calling for about 61 trillion people. The real world kept growing slowly instead, and the fight has shifted to whether slow growth is a relief or a new problem of its own.
x9m8 has looked at other curves that describe people: whether technology evolves the way living things do, whether humans are still evolving, and whether intelligent life is rare by the numbers.
Which leaves the question the 1960 paper was really asking. If the bend came from billions of separate choices, did a scary equation help, or would everyone have gotten there anyway?
Sources
- von Foerster, H., Mora, P. M., Amiot, L. W. “Doomsday: Friday, 13 November, A.D. 2026.” Science 132:1291–1295 (Nov. 4, 1960). Classroom scan: https://mozart.bioinfo.rpi.edu/bystrc/courses/biol4961/Doomsday.pdf
- Alan MacEachern (The Conversation), republished by Gizmodo: https://gizmodo.com/scientists-once-calculated-the-date-of-doomsday-and-its-next-month-2000820261
- Time, “Science: Doomsday in 2026 A.D.” (1960): https://time.com/archive/6647875/science-doomsday-in-2026-a-d
- Sciencing, “How A 1960’s Physicist Predicted The World Is Going To End On November 13, 2026”: https://www.sciencing.com/2138206/how-1960-physicist-predicted-world-end-november-13-2026/
- Brad Willms, “Doomsday, Friday November 13, 2026; Is it Really Coming?” (CMS 2010 abstract): https://w7.cms.math.ca/Reunions/ete10/abs/pdf/mee-bw.pdf
- Our World in Data, “Population” (HYDE 2023; Gapminder 2022; UN WPP 2024): https://ourworldindata.org/grapher/population
- Andrey Korotayev, Cliodynamics 17(2), 2026: https://escholarship.org/uc/item/5ft2c9z6