

Preprint, version 1 (November 2026). Not peer reviewed. This is the author’s manuscript, prepared for submission to a peer-reviewed journal. Download: PDF · Word · reproducibility package (zip) · code on GitHub (link added at publication) with code, results and the two independent audits.
Cite as: Kalafatis, P. (2026). Cuts and burns, not falls: nonfatal and fatal injury patterns in US food services, 2016–2024 [Preprint]. x9m8.com.
Peter Kalafatis (ORCID: https://orcid.org/0009-0000-1637-7142)
Independent researcher, x9m8.com, New York, NY, USA. Correspondence: x9m8x7@gmail.com
Version 1, November 2026.
Abstract
How restaurant injuries compare with the rest of the private economy, in rate, kind, and severity, is less often set out from the government’s own numbers than assumed. I compiled nine years (2016–2024) of BLS Survey of Occupational Injuries and Illnesses incidence-rate tables, the latest (2023–2024) detailed case tables, and 2024 Census of Fatal Occupational Injuries tables, for food services and drinking places (NAICS 722) against all private industry. The total recordable rate in food services fell from 3.1 to 2.4 cases per 100 full-time-equivalent workers between 2016 and 2024 (−22.6%), tracking the private-industry-wide fall from 2.9 to 2.3 (−20.7%); by 2024 the two rates were close. The mix of harm did not converge. Per worker, food-service cases with days away, restriction, or transfer (DART) involved cuts and lacerations at 1.7 times the all-industry rate and thermal plus chemical burns at 4.9 times the all-industry rate, while sprains and strains were less than half as common. Food-service injuries were also less severe: a median of 5 days away from work, against 8 industry-wide, and a smaller share running 31 or more days (17.6% versus 28.3%). Fatalities reversed the pattern again: the food-service fatal-injury rate (1.9 per 100,000 full-time-equivalent workers) was little more than half the all-industry rate (3.3), but half of its 144 workplace deaths in 2024 were classified as violent acts, chiefly robbery-related homicide, against 14.5% industry-wide. These are official counts and rates, not a causal test; I describe how the mix differs, not why.
Keywords: occupational injury; food services; restaurants; BLS; Survey of Occupational Injuries and Illnesses; burns; workplace homicide; incidence rate
Social media summary: Restaurant injury rates have converged with the rest of industry, but the mix hasn’t: more cuts and burns, fewer sprains, shorter absences, and far more violent deaths.

1. Introduction
Restaurant work has a reputation for burns, cuts, and slips that outpaces its reputation for careful measurement. Public-health surveillance has documented specific hazards such as occupational burns among restaurant workers for decades (Centers for Disease Control and Prevention, 1993). What is published less often is a simple, current comparison: how food-service injury rates, the kinds of injury involved, their severity, and their fatality profile compare with the private economy as a whole, drawn directly from the government surveys that are the basis for most other claims.
The BLS runs two relevant collection programs. The Survey of Occupational Injuries and Illnesses (SOII) is an annual establishment survey that estimates incidence rates and counts of recordable nonfatal workplace injuries and illnesses, by industry, and publishes detailed nature-of-injury, event-or-exposure, and days-away-from-work tables biennially (U.S. Bureau of Labor Statistics [BLS], 2023). The Census of Fatal Occupational Injuries (CFOI) is a census, not a sample, of every work-related fatality identified from multiple source documents, cross-verified against at least two independent sources (BLS, n.d.-a). Both programs classify industries using the North American Industry Classification System (NAICS); food services and drinking places is NAICS 722, and restaurants and other eating places, the subset excluding caterers and drinking places, is NAICS 7225.
Published peer-reviewed work on food-service injury has mostly looked at one hazard at a time: burns treated in hospital emergency departments, where food-service workers made up a sizeable share of occupational burn visits (Reichard et al., 2015), and workplace homicide, where one study examined non-robbery-related occupational homicides specifically within the retail trade sector, a category that includes eating and drinking places (Konda et al., 2014). I am not aware of a single account that places the nonfatal rate trend, the nature-of-injury mix, the severity distribution, and the fatality mix for food services side by side against the rest of private industry using the most recent public BLS tables. This paper does that: a descriptive compilation, not a new survey or model, intended to give restaurant operators, insurers, and safety planners a current, industry-comparative reference drawn entirely from BLS public data.
2. Methods
2.1 Data sources
All data are public-domain statistical tables published by the BLS, a U.S. federal statistical agency; works of the U.S. federal government are not subject to copyright in the United States (17 U.S.C. § 105), and BLS states that its data are in the public domain and may be freely reproduced (BLS, n.d.-b). No data were purchased, licensed, or obtained under restricted access; all files are the same public downloads any visitor to bls.gov can retrieve. I did not use the BLS public API (api.bls.gov), since the specific detailed tables needed (industry-by-nature, industry-by-event, and the biennial case-and-demographic tables) are published as downloadable spreadsheet tables rather than as API time series; the incidence-rate and fatality tables used here are the same tables the API would otherwise draw from.
Four sets of published BLS tables were used, each downloaded directly from bls.gov on 11 November 2026:
- SOII Table 1 (“Incidence rates of nonfatal occupational injuries and illnesses by industry and case types”), one file per year, 2016–2024, giving the total recordable, DART, days-away-from-work (DAFW), days-of-job-transfer-or-restriction (DJTR), and other-recordable rates per 100 FTE workers, for all private industry, NAICS 722, and NAICS 7225 (BLS, 2017-2025a; full list of per-year URLs and files in the reproducibility package).
- SOII Tables R5, R8, and R65, the 2023–2024 biennial case-and-demographic-characteristics tables, which break DART, DAFW, and DJTR cases down by detailed nature of injury (R5), by detailed event or exposure (R8), and by number of days away from work with the median (R65), each by detailed industry, private industry only (BLS, 2025b, 2025c, 2025d). These tables are published every two years rather than annually, so the most recent file available covers both 2023 and 2024 combined; no annual breakdown within that pair is published.
- CFOI Table A-1 (“Fatal occupational injuries by industry and event or exposure”), 2024, giving fatality counts by industry and broad event category for all U.S. industries and for NAICS 722 (BLS, 2026a).
- CFOI national hours-based fatal injury rates, 2024, giving the fatal injury rate per 100,000 FTE workers by industry, based on total hours worked rather than employment counts (BLS, 2026b).
Each downloaded file’s exact URL, byte size, and SHA-256 hash are recorded in the reproducibility package (data/raw/*.json and results/provenance.md), computed at the time of download from the file BLS served; anyone can re-download the same URL and confirm the hash matches.
2.2 Extraction and definitions
Each spreadsheet was parsed programmatically (a minimal in-browser ZIP and OOXML reader, since the shell environment used for this analysis could not reach bls.gov directly; see §2.5) to pull the rows for “Private industry” (or “All industry” in the R-series tables, which cover the private sector only), NAICS 722, and NAICS 7225, verbatim as published. No row was recomputed, interpolated, or adjusted; every number reported here is a BLS-published cell, or a simple ratio, percentage, or percentage-point difference between two BLS-published cells, computed by the code in this package.
DART, the headline severity category used throughout, comprises cases with one or more days away from work, one or more days of job transfer, one or more days of restricted work activity, or a combination; DAFW is the subset with at least one day away from work. “Nature of injury,” “event or exposure,” and days-away categories follow the BLS Occupational Injury and Illness Classification System (OIICS) (BLS, n.d.-c). A BLS-published dash (“–”) is treated as a reported value of zero, per BLS convention for these tables, not as a suppressed or withheld cell; no cell used in this analysis was marked as suppressed for disclosure reasons.
2.3 Comparisons
For each metric I report the BLS-published value for NAICS 722 (and, for the annual time series, also NAICS 7225) alongside the all-private-industry (or all-industry, for CFOI) value for the same year and table, and the simple ratio or percentage-point difference between them. These are descriptive comparisons of published aggregate statistics; they are not adjusted for establishment size, region, part-time share, or any other covariate, because BLS does not publish industry-by-covariate cross-tabulations at this level of nature/event detail. No statistical significance test is reported, because BLS does not publish standard errors for the R-series or CFOI tables used here (only for Tables 1, 2, and the SNR series, which are not the focus of the nature/event/severity comparisons); the SOII Table 1 time series does carry published relative standard errors in a companion table (Table A1) that was not pulled for this descriptive comparison, and the differences in the time series (§3.1) are discussed accordingly as point estimates.
2.4 Software, data and AI use
Analysis code is Python 3.13 with the standard library only (json, no numerical libraries were required beyond simple arithmetic); figures used matplotlib. The study was carried out with the assistance of Claude (Anthropic; model claude-sonnet-5) in November 2026, which retrieved the published BLS tables through a browser session, wrote and ran the extraction and analysis code, searched the literature, verified citations against Crossref and PubMed, and drafted the text under the author’s direction. The author reviewed the work and takes full responsibility for it.
2.5 A note on data retrieval
The browser session’s own command-line environment could not reach bls.gov (network policy blocked the destination), so a logged browser session was used to download each spreadsheet directly from its published BLS URL, compute its SHA-256 hash in-browser, and extract the required rows with a small purpose-built ZIP/XML parser (an .xlsx file is a ZIP archive of XML parts); no external parsing library was loaded, and the extracted values were transcribed into this package’s data/raw/*.json files together with the source URL and hash. This is a retrieval-path detail, not a modification of the data: every value in data/raw/ is read directly from the published cell, and the hash lets anyone re-download the same URL and verify the source file is unchanged.
3. Results
3.1 The rate trend, 2016–2024
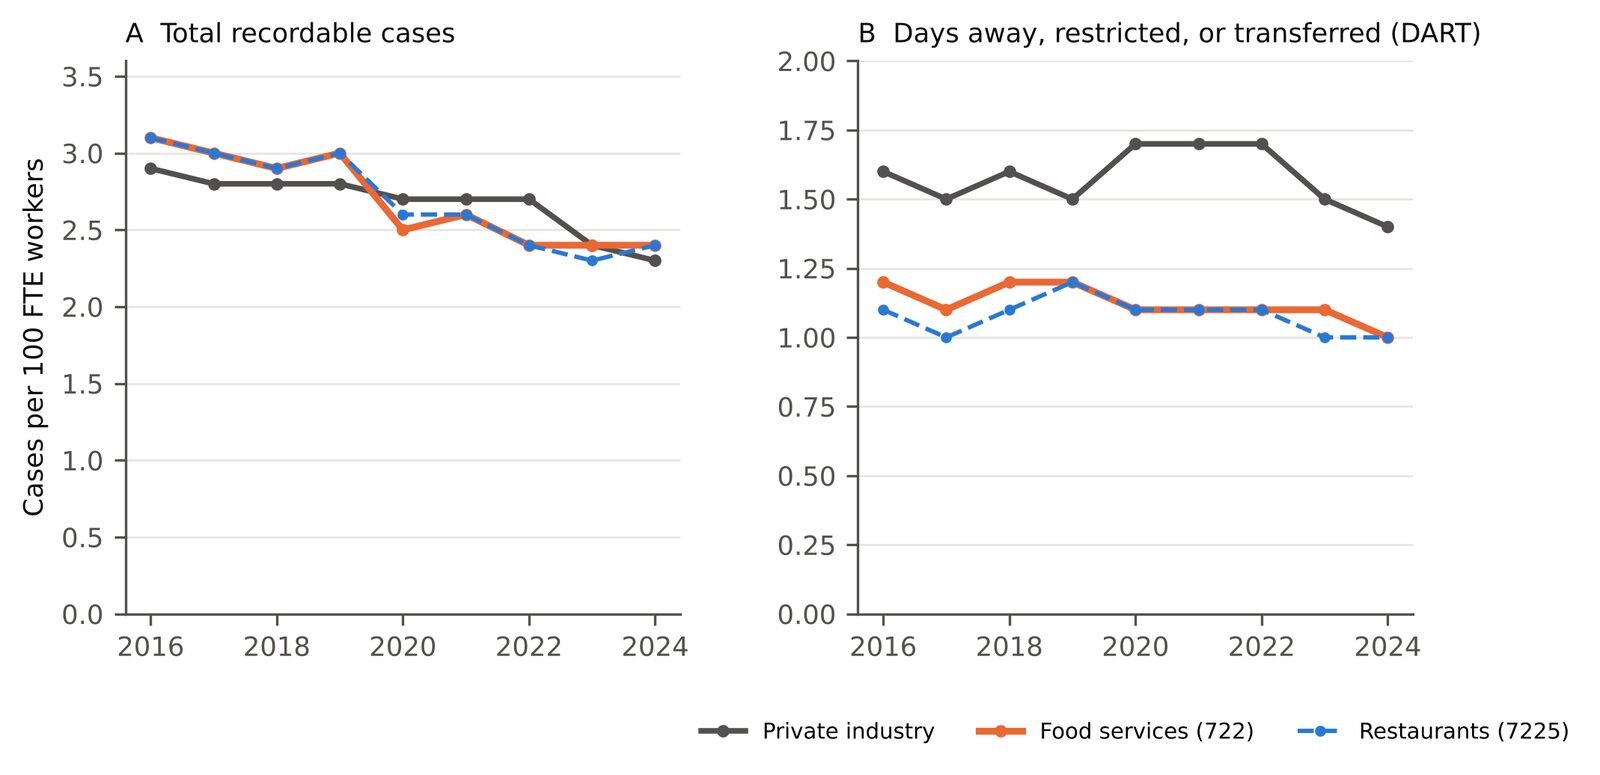
The total recordable incidence rate in food services and drinking places fell from 3.1 to 2.4 cases per 100 FTE workers between 2016 and 2024, a decline of 22.6% (Table 1; Figure 1A). Over the same years the all-private-industry rate fell from 2.9 to 2.3, a decline of 20.7%. The two series ran close together throughout: food services was higher than the private-industry average in every year from 2016 to 2021 (by 0.1 to 0.3 points), about even in 2022–2023, and slightly higher again in 2024 (2.4 versus 2.3). Restaurants specifically (NAICS 7225) tracked food services as a whole closely in every year (Table 1).
The DART rate shows a different pattern (Figure 1B). Food services ran persistently below the all-private-industry DART rate across the whole period: 1.2 against 1.6 in 2016, and 1.0 against 1.4 in 2024. In other words, a larger share of food-service recordable cases are “other recordable” cases, those not involving days away, restriction, or transfer, than is typical for private industry as a whole; the other-recordable rate was 1.3 to 1.9 per 100 FTE in food services across these years against 1.0 to 1.3 for all private industry (Table 1).
Table 1. Incidence rates of nonfatal occupational injuries and illnesses, private industry, food services and drinking places (NAICS 722), and restaurants and other eating places (NAICS 7225), 2016–2024. Cases per 100 full-time-equivalent (FTE) workers. Source: BLS Survey of Occupational Injuries and Illnesses (SOII), Table 1, annual national estimates.
| Year | Private, total | Private, DART | Food svcs. (722), total | Food svcs. (722), DART | Restaurants (7225), total | Restaurants (7225), DART |
|---|---|---|---|---|---|---|
| 2016 | 2.9 | 1.6 | 3.1 | 1.2 | 3.1 | 1.1 |
| 2017 | 2.8 | 1.5 | 3.0 | 1.1 | 3.0 | 1.0 |
| 2018 | 2.8 | 1.6 | 2.9 | 1.2 | 2.9 | 1.1 |
| 2019 | 2.8 | 1.5 | 3.0 | 1.2 | 3.0 | 1.2 |
| 2020 | 2.7 | 1.7 | 2.5 | 1.1 | 2.6 | 1.1 |
| 2021 | 2.7 | 1.7 | 2.6 | 1.1 | 2.6 | 1.1 |
| 2022 | 2.7 | 1.7 | 2.4 | 1.1 | 2.4 | 1.1 |
| 2023 | 2.4 | 1.5 | 2.4 | 1.1 | 2.3 | 1.0 |
| 2024 | 2.3 | 1.4 | 2.4 | 1.0 | 2.4 | 1.0 |
3.2 What specifically goes wrong
The 2023–2024 biennial detail tables show a nature-of-injury mix in food services that differs clearly from the all-industry average (Table 2; Figure 2). Per 10,000 FTE workers, DART cases classified as cuts, lacerations, or punctures occurred at 24.5 in food services against 14.6 industry-wide, a ratio of 1.68. Thermal burns were far more disproportionate: 11.1 against 1.9, a ratio of 5.84; adding the much smaller chemical-burns category (0.6 against 0.5), combined burns ran at 4.88 times the all-industry rate. Sprains, strains, and tears, the single largest nature-of-injury category industry-wide (51.2 per 10,000), were less than half as common in food services (21.8, a ratio of 0.43), and fractures and bruises were likewise somewhat less common in food services than industry-wide (Table 2).
The event-or-exposure table tells a related story (Table 3; Figure 3A). Overexertion and repetitive-motion events, the largest single category for all industry (44.7 per 10,000), were much less common in food services (16.8, 0.38 times the all-industry rate), consistent with the shallower sprains/strains burden just described. Falls, slips, and trips were somewhat below the all-industry rate (30.7 against 34.1), as were contact-with-objects-or-equipment events (39.1 against 40.6, nearly level). Exposure to harmful substances, the OIICS category that includes contact with hot surfaces and liquids as well as other exposures, ran somewhat higher in food services (13.8 against 10.6). Transportation incidents (1.4 against 5.7) and violence by another person (1.4 against 3.7) were both markedly rarer in food-service DART cases than industry-wide.
Table 2. Nature of injury or illness, DART cases (days away from work, restricted activity, or job transfer), all private industry versus food services and drinking places (NAICS 722), 2023–2024. Rate per 10,000 FTE workers. Source: BLS SOII Table R5.
| Nature | All industry | Food services (722) | Ratio, 722/all |
|---|---|---|---|
| Cuts, lacerations, punctures | 14.6 | 24.5 | 1.68 |
| Thermal burns | 1.9 | 11.1 | 5.84 |
| Chemical burns, corrosions | 0.5 | 0.6 | 1.2 |
| Sprains, strains, tears | 51.2 | 21.8 | 0.43 |
| Bruises, contusions | 13.8 | 10.4 | 0.75 |
| Fractures | 8.6 | 5.9 | 0.69 |
| Soreness, swelling, inflammation | 4.6 | 4.3 | 0.93 |
| Tendonitis and related | 0.7 | 0.3 | 0.43 |
| Carpal tunnel syndrome | 0.4 | 0.4 | 1.0 |
| Thermal + chemical burns, combined | 2.4 | 11.7 | 4.88 |

3.3 Severity: shorter absences, when they happen
Among DAFW cases, the median number of days away from work was 5 in food services against 8 for all industry (Table 3; Figure 3B). The distribution was shifted toward shorter absences throughout: 52.7% of food-service DAFW cases involved 5 or fewer days away, against 41.2% industry-wide, while 31 or more days away, the longest published bucket, covered 17.6% of food-service cases against 28.3% industry-wide.
Table 3. Event or exposure (DART cases) and days-away-from-work (DAFW) severity, all private industry versus food services and drinking places (NAICS 722), 2023–2024. Event rates per 10,000 FTE workers; severity as percentage of DAFW cases by number of days away and median days away. Source: BLS SOII Tables R8 and R65.
| Event or exposure | All industry | Food services (722) |
|---|---|---|
| Falls, slips, trips | 34.1 | 30.7 |
| Overexertion, repetitive motion | 44.7 | 16.8 |
| Contact with objects or equipment | 40.6 | 39.1 |
| Exposure to harmful substances | 10.6 | 13.8 |
| Transportation incidents | 5.7 | 1.4 |
| Violence by other person | 3.7 | 1.4 |
| Median days away from work (DAFW cases) | 8 | 5 |
| Share of DAFW cases, 31 or more days | 28.3% | 17.6% |
| Share of DAFW cases, 5 or fewer days | 41.2% | 52.7% |

3.4 Fatalities: a smaller rate, a different cause
The 2024 fatal-injury rate in food services and drinking places was 1.9 per 100,000 FTE workers, against 3.3 for all civilian workers, a ratio of 0.58 (Table 4). Food services recorded 144 fatal occupational injuries in 2024 (108 of them in restaurants specifically, NAICS 7225), against 5,070 across all U.S. industries. The cause mix, however, was inverted relative to the rest of the economy. Violent acts, overwhelmingly robbery-related homicide in this industry, accounted for 72 of the 144 food-service deaths (50.0%), against 733 of 5,070 (14.5%) industry-wide. Transportation incidents, the single largest cause of workplace death industry-wide (1,937 of 5,070, 38.2%), accounted for only 15 of 144 food-service deaths (10.4%), consistent with the much smaller share of the food-service workforce that drives for a living. Falls, slips, and trips (20 deaths) and exposure to harmful substances (34 deaths) made up most of the remainder; BLS reported no food-service fatalities in the explosions-and-fires category for 2024 (Table 4).
Table 4. Fatal occupational injuries by event or exposure, all United States industries versus food services and drinking places (NAICS 722), 2024, and the hours-based fatal injury rate. Source: BLS Census of Fatal Occupational Injuries (CFOI), Table A-1 and national hours-based rate tables.
| All industries | Food services (722) | |
|---|---|---|
| Total fatal injuries, 2024 (count) | 5070 | 144 |
| Violent acts (count, % of total) | 733 (14.5%) | 72 (50.0%) |
| Transportation incidents (count, % of total) | 1937 (38.2%) | 15 (10.4%) |
| Falls, slips, trips (count) | 844 | 20 |
| Exposure to harmful substances (count) | 687 | 34 |
| Fatal injury rate (per 100,000 FTE workers) | 3.3 | 1.9 |
4. Discussion
4.1 A converging rate, a persistent difference in kind
By the plainest measure, the total recordable injury and illness rate, food service is no longer the outlier it may once have been: its 2024 rate (2.4 per 100 FTE) sat almost exactly on the all-private-industry rate (2.3), and both fell by about a fifth to a quarter over nine years. Stopping at that one number would miss nearly everything interesting in these tables. Food-service DART cases run disproportionately to cuts and especially burns, and disproportionately not to the sprains and overexertion injuries that dominate the rest of the economy; and when a food-service worker is hurt badly enough to miss work, the absence is typically shorter. None of this is unexpected to anyone who has worked a kitchen line, but it has rarely been laid out this plainly from BLS’s own tables side by side.
The nature and severity findings may be connected. A kitchen cut or a contact burn is usually a discrete, treatable injury with a defined, often short, recovery; a repetitive-motion or overexertion injury, more common in warehousing, manufacturing, and healthcare, can involve a longer and less certain course. That is a plausible mechanism for the shorter median absence in food services, not a finding this descriptive comparison can test directly, since BLS does not publish a nature-by-days-away cross-tabulation at the detailed-industry level in the tables used here.
4.2 Violence as an occupational hazard specific to this industry
The fatality profile is the sharpest contrast in the data. Food service has a lower fatal-injury rate than the private economy as a whole, yet half of its fatalities are classified as violent acts, overwhelmingly robbery-related, against roughly one in seven industry-wide. This matches the earlier finding that retail trade, which includes eating and drinking places, carries a disproportionate share of non-robbery-related occupational homicides as well (Konda et al., 2014), and situates food service alongside other late-hours, cash-handling, public-facing workplaces where violence prevention, not fall protection or machine guarding, is the dominant safety concern for the rare but catastrophic outcome.
4.3 What this means for an operator
For a restaurant operator or an insurer pricing a restaurant’s workers’ compensation risk, these patterns argue for a specific, rather than generic, safety programme: first-aid and burn-prevention protocols (anti-scald equipment, proper handling of hot oil and liquids, and rapid burn first-aid) and cut-prevention protocols (knife-handling training, cut-resistant gloves, slicer guarding) address the categories where food service is most disproportionate, while generic ergonomics and lifting programmes aimed at sprains and overexertion, though still worthwhile, address a smaller share of food-service harm than they would in a warehouse or hospital. Separately, the robbery-homicide finding argues for cash-handling and after-hours security measures as a distinct line item in a restaurant safety plan, not an afterthought to kitchen safety.
4.4 Limitations
This is a descriptive compilation of published aggregate tables, not a new survey, a regression, or a causal analysis; every comparison here is a difference or ratio between two BLS-published numbers, and no claim is made about why the industries differ beyond the plausible, unverified mechanisms noted above. The detailed nature, event, and severity tables (R5, R8, R65) cover only the most recent published biennial period, 2023–2024 combined; I cannot say from these tables whether the nature-of-injury or severity gap has been stable, widening, or narrowing over time, only that the 2016–2024 rate trend (§3.1) has been converging. The 2023–2024 tables are for private industry only and are not broken out further by NAICS 7225 for every cell I examined; where a restaurant-specific figure was available it is reported in Table 1, but the nature, event, and severity detail tables (Tables 2–3) are for food services and drinking places (NAICS 722) as a whole, which also includes caterers and drinking places. No standard errors are published for the R-series or CFOI tables used in Tables 2–4, so none of the differences reported here carry a formal measure of sampling uncertainty, and small cross-year or cross-category differences, particularly in tables with modest counts, should be read as descriptive rather than as established beyond sampling variation. CFOI is a census of verified fatalities, not a sample, but a single year (2024) of fatality counts for one industry, especially the event-category breakdown with counts in the dozens, is subject to considerable year-to-year variability; a multi-year average would be more stable, and is a natural extension of this work. Finally, some of the academic studies cited in a U.S. Government Accountability Office review have found that SOII undercounts some workplace injuries and illnesses, in part because employers’ own OSHA logs, the survey’s source records, can be incomplete; that GAO review’s own, narrower conclusion was that OSHA’s process for auditing employers’ injury and illness records may not be adequate to ensure their accuracy (U.S. Government Accountability Office, 2009). If under-reporting differs by industry, for example because small, high-turnover establishments common in food service under-record more than large ones, it could affect the comparisons here, and I have not attempted to correct for it.
5. Conclusion
Nine years of BLS incidence-rate data show food-service injury and illness rates converging with the rest of private industry, but the detailed 2023–2024 tables show the kind of harm has not converged: food-service workers are cut and burned at a much higher rate than the private-sector average, are hurt by overexertion at a much lower rate, and when they are hurt badly enough to miss work, they tend to miss less of it. Fatalities invert the usual industry pattern again: a below-average death rate driven disproportionately by violence rather than by the transportation and machinery hazards that dominate fatal risk elsewhere. These are official, publicly available numbers; an operator, an insurer, or a safety planner working from the overall recordable rate alone would be planning for the wrong hazard.
Related on x9m8
- What starts fires in restaurants and bars: Twenty-one years of US Fire Administration national estimates for eating and drinking establishments, 2003–2023
- Not all eating out: GLP-1 uptake and US restaurant employment by segment, 2019–2025
- Open Questions: a series on what science and law have not settled
Acknowledgements
The author thanks the U.S. Bureau of Labor Statistics for maintaining and publishing the Survey of Occupational Injuries and Illnesses and the Census of Fatal Occupational Injuries as public-domain data. Claude (Anthropic; model claude-sonnet-5) assisted with data retrieval, analysis code, literature search, citation verification, and drafting in November 2026, as described in §2.4. The author reviewed all outputs and is responsible for the content.
Author contributions
P.K. conceived the study, directed the analysis, and reviewed and approved the manuscript.
Financial support
This research received no specific grant from any funding agency, commercial or not-for-profit sector.
Conflicts of interest
The author operates a restaurant (The Heritage Diner) as a W-2 employee of its owner. This paper’s subject, workplace injury in food services, bears directly on that work; the author declares no other financial interest in the restaurant, insurance, or occupational-safety industries, and received no compensation related to this paper from any party with an interest in its findings.
Research transparency and reproducibility
All data are public-domain BLS statistical tables (Survey of Occupational Injuries and Illnesses and Census of Fatal Occupational Injuries), U.S. government works not subject to copyright (17 U.S.C. § 105). Code, extracted data tables with source URLs and SHA-256 hashes, and a provenance log are in the reproducibility package linked from the article page.
References
Bureau of Labor Statistics. (n.d.-a). Handbook of methods: Census of Fatal Occupational Injuries – overview. U.S. Department of Labor. https://www.bls.gov/opub/hom/cfoi/home.htm
Bureau of Labor Statistics. (n.d.-b). BLS copyright information. U.S. Department of Labor. https://www.bls.gov/opub/copyright-information.htm
Bureau of Labor Statistics. (n.d.-c). Occupational Injury and Illness Classification System (OIICS) manual, version 3.03. U.S. Department of Labor. https://www.bls.gov/iif/definitions/occupational-injuries-and-illnesses-classification-manual.htm
Bureau of Labor Statistics. (2017–2025a). Table 1. Incidence rates of nonfatal occupational injuries and illnesses by industry and case types [Annual data files, 2016–2024]. U.S. Department of Labor. https://www.bls.gov/iif/nonfatal-injuries-and-illnesses-tables.htm
Bureau of Labor Statistics. (2023). Handbook of methods: Survey of Occupational Injuries and Illnesses – overview. U.S. Department of Labor. https://www.bls.gov/opub/hom/soii/home.htm
Bureau of Labor Statistics. (2025b). Table R5. Detailed industry by selected natures of injury or illness (rate), 2023–2024. U.S. Department of Labor. https://www.bls.gov/iif/nonfatal-injuries-and-illnesses-tables/case-and-demographic-characteristics-table-r5-2023-2024.xlsx
Bureau of Labor Statistics. (2025c). Table R8. Detailed industry by selected events or exposures (rate), 2023–2024. U.S. Department of Labor. https://www.bls.gov/iif/nonfatal-injuries-and-illnesses-tables/case-and-demographic-characteristics-table-r8-2023-2024.xlsx
Bureau of Labor Statistics. (2025d). Table R65. Detailed industry by number of days by case type, 2023–2024. U.S. Department of Labor. https://www.bls.gov/iif/nonfatal-injuries-and-illnesses-tables/case-and-demographic-characteristics-table-r65-2023-2024.xlsx
Bureau of Labor Statistics. (2026a). Table A-1. Fatal occupational injuries by industry and event or exposure, all United States, 2024. U.S. Department of Labor. https://www.bls.gov/iif/fatal-injuries-tables/fatal-occupational-injuries-table-a-1-2024.xlsx
Bureau of Labor Statistics. (2026b). National hours-based fatal injury rates by industry, occupation, and selected demographic characteristics, 2024. U.S. Department of Labor. https://www.bls.gov/iif/fatal-injuries-tables/fatal-occupational-injuries-hours-based-rates-2024.xlsx
Centers for Disease Control and Prevention. (1993). Occupational burns among restaurant workers – Colorado and Minnesota. MMWR Morbidity and Mortality Weekly Report, 42(37), 713–716.
Konda, S., Tiesman, H. M., Hendricks, S., & Gurka, K. K. (2014). Non-robbery-related occupational homicides in the retail industry, 2003–2008. American Journal of Industrial Medicine, 57(2), 245–253. https://doi.org/10.1002/ajim.22283
Reichard, A. A., Konda, S., & Jackson, L. L. (2015). Occupational burns treated in emergency departments. American Journal of Industrial Medicine, 58(3), 290–298. https://doi.org/10.1002/ajim.22407
U.S. Government Accountability Office. (2009). Workplace safety and health: Enhancing OSHA’s records audit process could improve the accuracy of worker injury and illness data (GAO-10-10). https://www.gao.gov/products/gao-10-10

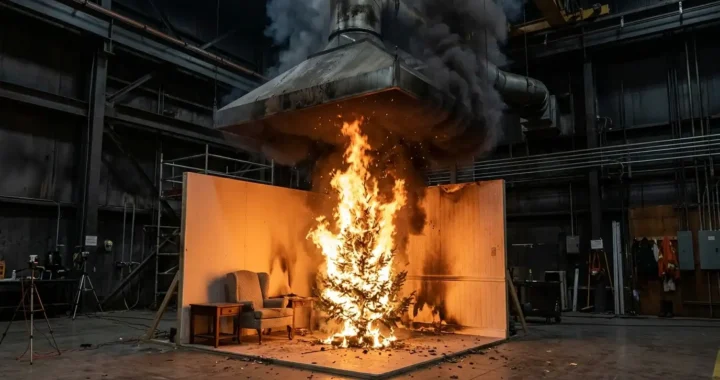


[…] nobody would want it next to a wing chair; commercial kitchens, where burns are a routine entry in federal injury data for food service, treat far smaller flames with respect. It is also not in the same category as the dry […]