
Preprint, version 1 (October 2026). Not peer reviewed. This is the author’s manuscript, prepared for submission to a peer-reviewed journal. Download: PDF · Word · reproducibility package (zip) · code on GitHub with code, results and the two independent audits.
Cite as: Kalafatis, P. (2026). Drive-thru dose–response: GLP-1 uptake and US restaurant employment [Preprint]. x9m8.com. https://doi.org/10.5281/zenodo.23751508
Peter Kalafatis
Independent researcher, x9m8.com, New York, NY, USA. Correspondence: x9m8x7@gmail.com
Version 1, October 2026.
Competing interest, stated up front: the author operates The Heritage Diner, a full-service restaurant in Mount Sinai, New York. See Conflicts of interest.
Abstract
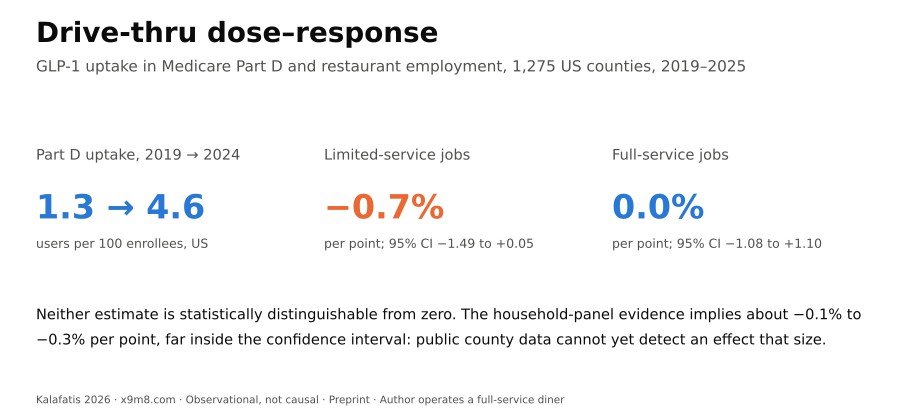
Households that start GLP-1 receptor agonists spend 8.0% less at fast-food chains, coffee shops and limited-service restaurants. Whether this reaches local restaurant markets is unknown. I linked Medicare Part D prescribing of GLP-1 drugs to county employment, establishments and wages from the Quarterly Census of Employment and Wages for 1,275 US counties. Part D uptake (full-year users per 100 enrollees) rose from 1.3 to 4.6 nationally between 2019 and 2024. In long differences from 2019 to 2025 with state fixed effects and pre-period trends, each 1-point rise in uptake was associated with −0.72% limited-service employment (95% CI −1.49 to 0.05) and 0.01% full-service employment (−1.08 to 1.10); the limited-minus-full gap was −0.73% (−1.94 to 0.47). Limited-service estimates were negative in 9 of 10 specifications, and a prescriber-based exposure gave a significant negative gap (−0.72% per unit, p = 0.017). But weighting by each industry’s 2019 employment moved the limited-service estimate to 0.02%, and the pharmacy positive control failed its pre-trend test. Household evidence implies about −0.08% to −0.32% per point, inside the limited-service and gap intervals; minimum detectable effects are 3 to 14 times larger. If the design is valid, only large effects are excluded; effects of the size household data imply can be neither confirmed nor excluded.
Keywords: GLP-1 receptor agonists; semaglutide; tirzepatide; restaurants; limited-service; employment; QCEW; Medicare Part D; minimum detectable effect; event study
Social media summary: GLP-1 drugs and fast-food jobs: county data from 2019 to 2025 show no clear effect, but they are too noisy to detect one the size household data imply.
1. Introduction
GLP-1 receptor agonists reduce appetite, and their use in the United States has grown quickly. In a national poll fielded from late October to early November 2025, 12% of adults said they were currently using a GLP-1 drug and 18% that they had ever used one (Montero et al., 2025). The restaurant industry has asked what this means for its sales. The best evidence so far comes from household purchase panels. Hristakeva et al. (2026) linked survey responses on GLP-1 adoption to transaction data from a US household panel. They report that households with at least one user cut grocery spending by 5.3% within six months of adoption and found “an 8.0% decline in spending at fast-food chains, coffee shops, and limited-service restaurants”. Wang and Balagtas (2026), using a matched staggered difference-in-differences design on a household transaction panel, found that grocery spending fell 6.2% in the half-year of adoption. Their abstract does not report restaurant outcomes.
Other evidence points in different directions. Using meal reports from a consumer survey, Bina and Tonsor (2026) found that GLP-1 users differ from non-users in where they eat and in meal skipping, with the differences largest among shorter-term users. The study examines associations between use and meal choices, not the effect of starting the drug. The closest work to an area-level design is an undergraduate thesis by Resendiz (2026). It used a state panel for 2017–2024 with two-way fixed effects and Medicaid GLP-1 coverage and spending as the exposure. It found no significant effect of coverage or total Medicaid GLP-1 spending on fast-food establishments, revenue, employment or wages. Of the drug-specific measures, Zepbound spending was negatively associated with fast-food establishments (at the 5% level) and with employment (at the 10% level, depending on how spending was measured). When spending was scaled per Medicaid enrollee, the employment association was significant under every measure and an association with revenue appeared; Wegovy and Saxenda showed none. The author reads these results as early evidence of a detectable effect. Only the thesis abstract is public; the full text is embargoed until 27 April 2028.
A household-level effect does not automatically translate into a local-market effect. A household that buys fewer burgers is a small part of a county’s demand. Restaurants can respond through prices, menus and hours before they cut staff. Users may also switch from limited-service to full-service meals rather than eat out less. For a county, the relevant quantity is the household effect multiplied by the change in the share of households that use the drug. That product is small. If uptake among households rises by one percentage point and adopting households spend 8.0% less at limited-service restaurants, county limited-service spending falls by about 0.08%. A study of county data therefore has to say how large an effect it could have detected, not only whether it found one.
This paper asks two questions. First, did US counties where GLP-1 use rose faster between 2019 and 2024 see slower growth in limited-service restaurant employment, establishments and wages than in full-service restaurants? Second, under the design’s assumptions, how large an effect do public data allow us to rule out? I measure GLP-1 use from Medicare Part D prescribing and outcomes from the Quarterly Census of Employment and Wages (QCEW), and report minimum detectable effects next to every estimate. I am not aware of an earlier study that links county GLP-1 prescribing to restaurant employment, or that contrasts limited-service with full-service restaurants at the area level.
2. Methods
2.1 Exposure: GLP-1 uptake in Medicare Part D
The Centers for Medicare & Medicaid Services (CMS) publish, for each data year, the number of Part D claims and 30-day fills written by each prescriber for each drug, identified by brand and generic name (CMS, 2026a). Rows with fewer than 11 claims are omitted from the file. I extracted all rows for 2019–2024 whose generic name was semaglutide, tirzepatide, liraglutide, dulaglutide, exenatide (including the extended-release microspheres), lixisenatide, albiglutide, or the insulin combinations with liraglutide or lixisenatide. The file gives the prescriber’s city and state but not the ZIP code. I took the ZIP code from the companion file of Part D prescribers by provider (CMS, 2026b), joined on the National Provider Identifier. ZIP codes were mapped to counties with the 2020 Census ZCTA-to-county relationship file, assigning each ZCTA to the county containing the largest share of its land area (U.S. Census Bureau, 2021). ZIP codes were treated as ZCTAs, so post-office-box and single-organisation ZIP codes do not match. The denominator was the county’s Part D enrollees in the same year, from the Medicare Monthly Enrollment file (CMS, 2026c).
The exposure is uptake, E: GLP-1 30-day fills in the county divided by 12 and by Part D enrollees, times 100. One unit is one full-year-equivalent user per 100 enrollees, or one percentage point if each user filled for a whole year. The main exposure is the change from 2019 to 2024, the most recent Part D year, winsorised at the 1st and 99th percentiles of the analysis sample. Two alternatives were used, each winsorised in the same way: uptake of semaglutide and tirzepatide only, and GLP-1 claims per 1,000 of all Part D claims written by prescribers in the county. The second has numerator and denominator both located by prescriber, so it is not affected by patients who see a doctor in another county.
To check the construction, I compared the extracted totals with the CMS file by geography and drug (CMS, 2026d), which is built from all claims rather than from the prescriber-level rows. Fills in the prescriber-level extract were 72.9% of the national total in 2019 and 88.5% in 2024. Of those fills, 99.0% to 99.2% were matched to a county in each year. Summed to states, the county totals tracked the CMS state totals across states (correlation at least 0.998 in every year), but in levels they fell short: the median ratio of the summed county total to the CMS state total was 0.70 in 2019 and 0.87 in 2024, reflecting the omitted small rows. Because this coverage rose over time and probably differs with prescriber size, and so with county type, the measured change in uptake contains error that need not be classical (§4.3). National uptake figures quoted below use the complete national file; county uptake uses the extract and is therefore somewhat lower.
2.2 Outcomes: restaurant employment, establishments and wages
Outcomes came from the QCEW annual averages for 2015–2025, private ownership, by county (U.S. Bureau of Labor Statistics, 2026). The two industries of interest were full-service restaurants (NAICS 722511) and limited-service restaurants (722513). For each I used annual average employment, annual average establishments and total annual wages, in logs. The QCEW suppresses cells that could disclose a single employer, so the main sample was restricted to counties with all three measures disclosed for both industries in every year. I also required at least 1,000 Part D enrollees in 2019. Alaska and Connecticut were excluded because their county definitions changed during the period (in Alaska, Valdez-Cordova was split in two; Connecticut’s QCEW data moved from counties to planning regions).
Three comparison industries were used. Pharmacies and drug stores (NAICS 446110 to 2021, 456110 from 2022 after the NAICS revision) were a positive control, on the reasoning that more prescriptions could mean more pharmacy work. GLP-1 fills are a small share of pharmacy volume, so a true effect on pharmacy employment is probably well below what this design can detect; the control is informative mainly through its pre-trends. Accommodation (721) was a placebo: hotels serve travellers, so local GLP-1 uptake should not affect them. Supermarkets and grocery stores (445110) were exploratory, because the household studies find lower grocery spending. Each was analysed in the counties of the main sample where it was disclosed.
2.3 Long differences
The main specification regressed the 2019–2025 change in log outcome on the 2019–2024 change in uptake, with state fixed effects. Using state fixed effects means each estimate compares counties within the same state. Controls were the county’s own 2015–2019 change in the outcome, log private employment in 2019, the 2015–2019 change in log private employment, log Part D enrollees in 2019 and uptake in 2019. The “limited minus full” outcome is the difference between the two log changes, so it nets out anything common to both restaurant types in a county. Standard errors were clustered by state (48 clusters for most outcomes), with inference from the t distribution with one fewer degree of freedom than the number of clusters (Cameron & Miller, 2015). In a robustness specification each county was weighted by its 2019 employment in the industry concerned (for the contrast, by limited-service plus full-service employment), so that larger restaurant markets count more. Coefficients are reported as the percentage change in the outcome per 1-point rise in uptake and per standard deviation of the change.
2.4 Event study
For each year t from 2015 to 2025 other than 2019, I regressed the change in log employment from 2019 to t on the 2019–2024 change in uptake, with state fixed effects and baseline controls (log private employment, log Part D enrollees and uptake, all in 2019). Differencing from 2019 removes county fixed effects. Running the regression separately by year with state fixed effects is equivalent to including state-by-year fixed effects and letting the controls’ coefficients vary by year. The 2015–2018 coefficients test for differential pre-trends. I tested them jointly in a stacked regression with state-by-year fixed effects, clustered by state. A pre-trend test that passes is weak evidence on its own (Roth, 2022), so the event study is read together with the long differences and the comparison industries.
2.5 Power and the benchmark
For every estimate I report the minimum detectable effect (MDE): the true effect that a two-sided 5% test would detect with 80% probability, (t0.975 + t0.80) × standard error (Bloom, 1995). To judge whether a null result is informative, I compared estimates with an effect scaled from the household evidence. Suppose that when Part D uptake rises by one point, the share of households containing a user rises by m points, and that adopting households cut limited-service spending by 8.0% (Hristakeva et al., 2026). Then county limited-service spending falls by 0.08 × m per cent per point. I used m = 1, 2 and 4, giving −0.08%, −0.16% and −0.32% per point. An m above 1 allows for the facts that a household contains more than one person and that Part D misses most use outside Medicare. This benchmark is for spending; employment would move by the same proportion only if labour is fully variable, so it is if anything an upper bound for employment.
2.6 Secondary state analysis
The only public monthly restaurant spending series below the national level that I found is the Opportunity Insights Economic Tracker, which publishes card spending on accommodation and food services by state, measured relative to 6 January–2 February 2020 and seasonally adjusted (Chetty et al., 2024; Opportunity Insights, 2026). The Bureau of Economic Analysis’s annual state consumption estimates also exist but likewise combine food services with accommodation. Because the tracker starts in 2020 and combines hotels with restaurants, I used it only as a secondary check. For 50 states and the District of Columbia, I regressed the change in log(1 + index) from the 2022 mean to the 2025 mean on the 2022–2024 change in state Part D uptake. State uptake was computed from the CMS geography file, and the model controlled for 2022 uptake, with heteroskedasticity-robust standard errors (one cluster per state, t with 50 degrees of freedom).
2.7 Software, data and AI use
Analyses used Python with pandas, NumPy and SciPy; figures used matplotlib. Because the analysis environment had no direct internet access, the public files were fetched in a web browser, reduced to the required rows and columns there, and the Python scripts in the reproducibility package were run unchanged inside the browser with Pyodide 0.26.4 (Python 3.12, pandas 2.2.0, NumPy 1.26.4, SciPy 1.12.0). The result files were transferred back and checked byte for byte with SHA-256 hashes. An equivalent download script for an ordinary computer is included. All data were retrieved on 22 October 2026. The study was carried out with the assistance of Claude (Anthropic; model claude-opus-5-5) in October 2026, which retrieved data, wrote and ran the analysis code, searched the literature and drafted the text under the author’s direction. The author reviewed the work and takes full responsibility for it.
3. Results
3.1 Sample and exposure
Exposure and QCEW data were joined for 3,046 counties. Of these, 2,703 had at least 1,000 Part D enrollees in 2019, and 1,275 in 48 states had restaurant employment, establishments and wages disclosed for both industries in every year from 2015 to 2025 (Table 1). The sample contains 86.6% of the 2019 Part D enrollees in the joined counties. It is weighted toward larger counties, because small counties are more often suppressed.
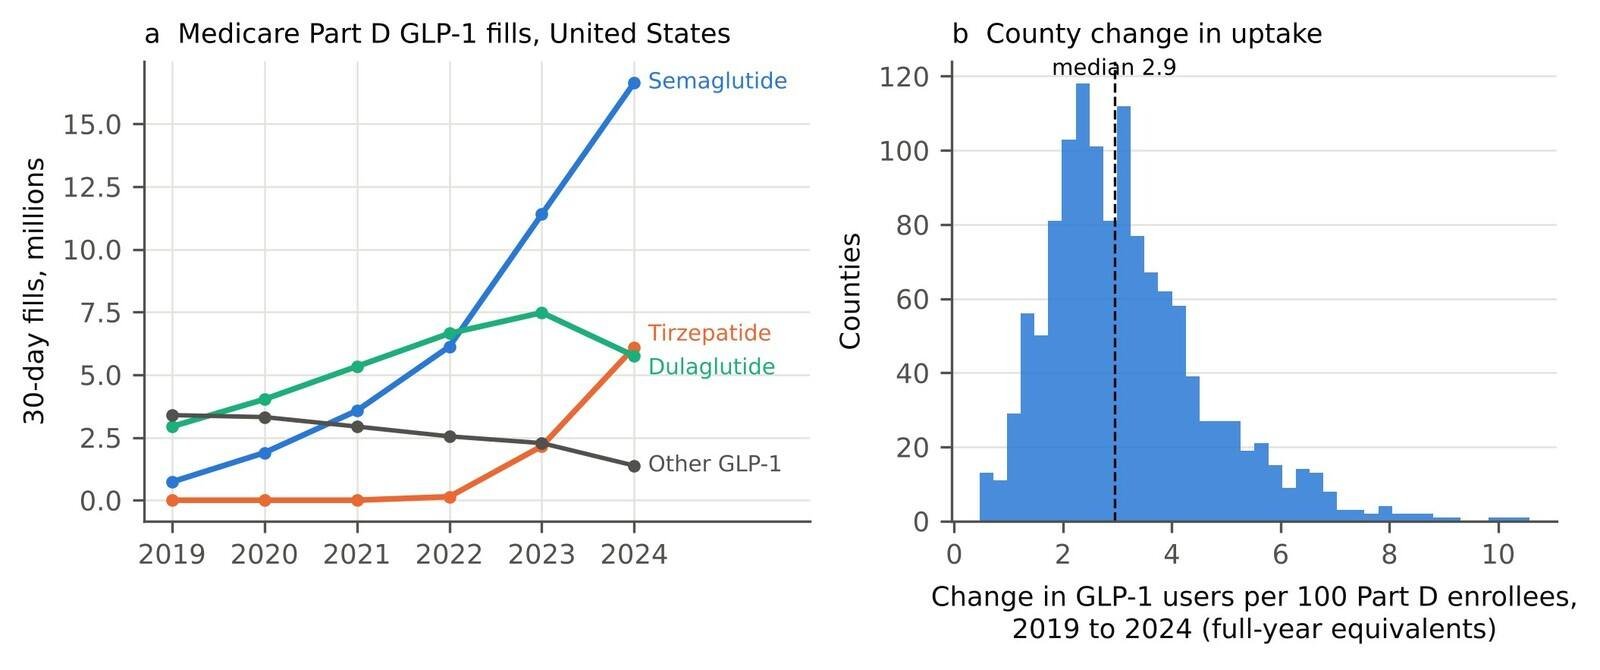
Nationally, Part D GLP-1 fills rose 4.2-fold between 2019 and 2024, and uptake rose from 1.3 to 4.6 full-year users per 100 enrollees (Figure 1a). Semaglutide and tirzepatide made up 10.3% of GLP-1 fills in 2019 and 76.1% in 2024. In the sample, mean uptake rose from 0.96 to 4.20. The median county rise was 2.94 points, with a 10th to 90th percentile range of 1.54 to 5.28 (Figure 1b). The standard deviation of the winsorised change was 1.53 points.
Over the same years, employment in the sample counties grew in limited-service restaurants, from 4.06 million to 4.16 million, and fell in full-service restaurants, from 5.05 million to 4.91 million. The mean county change in log employment was 2.44% for limited-service and −1.47% for full-service restaurants.
Table 1. Analysis sample. Counties with at least 1,000 Medicare Part D enrollees in 2019 and with employment, establishments and wages disclosed by the QCEW for both limited-service (NAICS 722513) and full-service (722511) restaurants in every year 2015–2025. Uptake is GLP-1 receptor agonist 30-day fills written by prescribers located in the county, divided by 12 and by the county’s Part D enrollees, per 100 enrollees.
| Quantity | Value |
|---|---|
| Counties joined (exposure and QCEW) | 3,046 |
| … with ≥1,000 Part D enrollees in 2019 | 2,703 |
| … and restaurant data disclosed in all years (analysis sample) | 1,275 |
| States (clusters) | 48 |
| Share of Part D enrollees (2019) in joined counties covered by the sample | 86.6% |
| GLP-1 uptake 2019, mean across counties (enrollee-weighted) | 0.96 (0.97) |
| GLP-1 uptake 2024, mean across counties (enrollee-weighted) | 4.20 (4.16) |
| Change 2019–2024: median (10th–90th percentile) | 2.94 (1.54 to 5.28) |
| Change 2019–2024: SD after winsorising at 1st/99th percentiles | 1.53 |
| Limited-service employment in sample, 2019 → 2025 | 4.06 m → 4.16 m |
| Full-service employment in sample, 2019 → 2025 | 5.05 m → 4.91 m |
| Mean county change in log employment 2019–2025, limited / full service | 2.44% / −1.47% |
3.2 Long differences
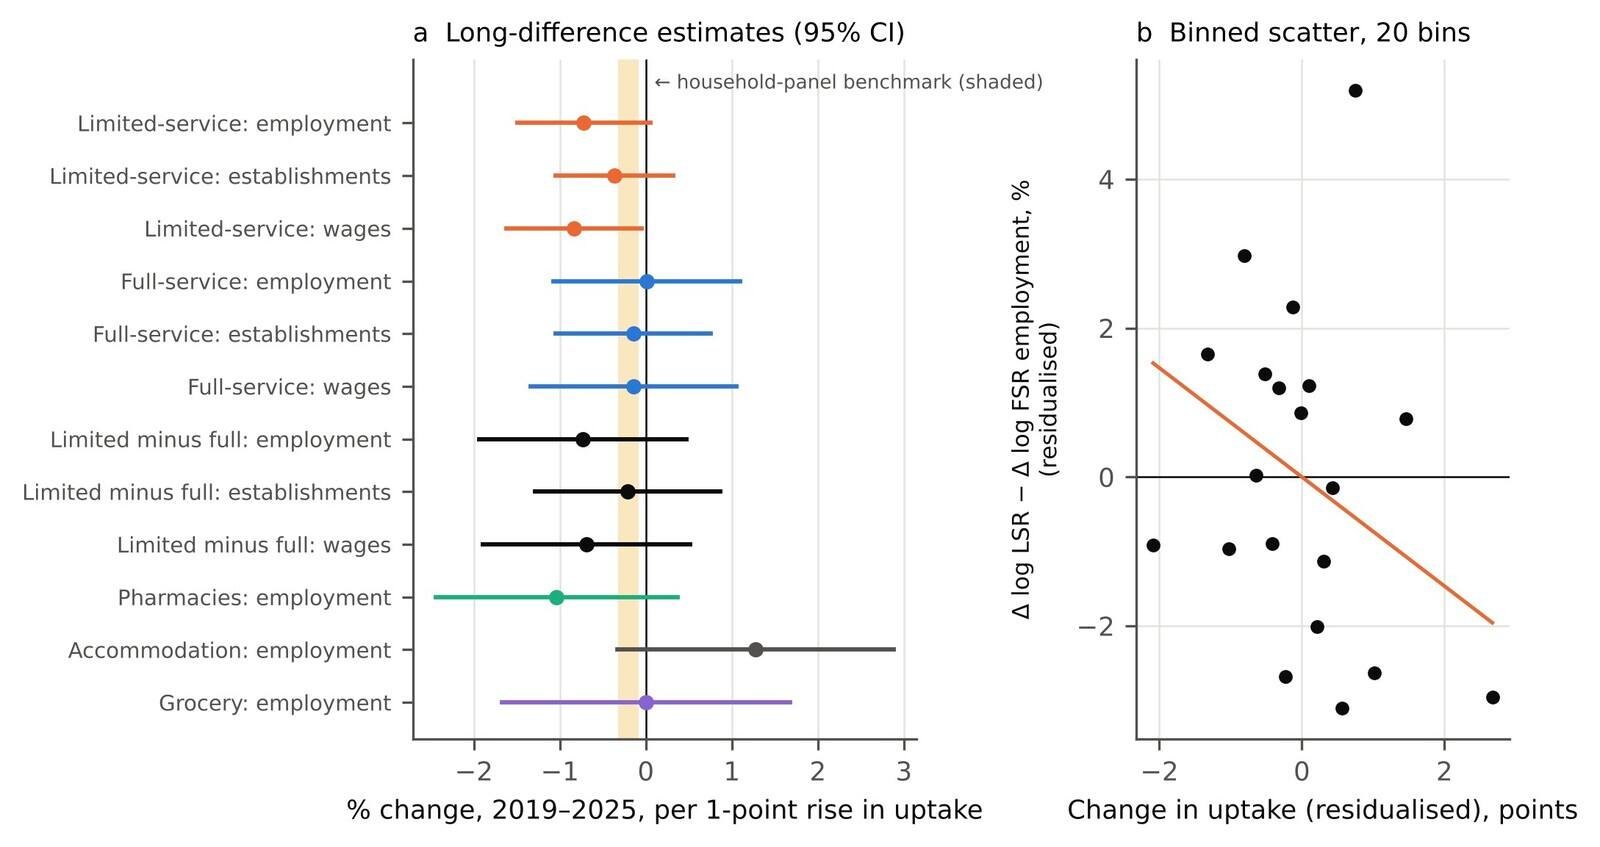
Each 1-point rise in uptake was associated with a 0.72% smaller rise in limited-service employment (95% CI −1.49 to 0.05; p = 0.066) (Table 2; Figure 3a). The estimate for establishments was −0.37% (−1.05 to 0.32) and for total wages −0.84% (−1.62 to −0.05; p = 0.037). In full-service restaurants the employment estimate was 0.01% (−1.08 to 1.10), the establishment estimate −0.14% (−1.05 to 0.76) and the wage estimate −0.14% (−1.34 to 1.06). The limited-minus-full contrast was −0.73% for employment (−1.94 to 0.47; p = 0.227), −0.21% for establishments and −0.69% for wages, none distinguishable from zero. Figure 3b shows the binned scatter for the employment contrast; the bins are widely dispersed around the fitted line.
Per standard deviation of the change in uptake, the limited-service employment estimate was −1.10% (−2.28 to 0.08). Twelve outcomes were tested. The one interval that excluded zero, limited-service wages (p = 0.037), would not survive a Bonferroni correction (threshold 0.05/12 = 0.0042), and I do not treat it as a finding on its own.
The minimum detectable effect for limited-service employment was 1.10% per point. For the limited-minus-full contrast it was 1.71%, and for full-service employment 1.55%.
Table 2. Long differences, 2019–2025. Coefficient on the 2019–2024 change in GLP-1 uptake (users per 100 Part D enrollees), expressed as the percentage change in the outcome per 1-point rise in uptake, and per standard deviation (SD) of the change. All models include state fixed effects, the outcome’s own 2015–2019 change, log private employment (2019), log Part D enrollees (2019), uptake in 2019 and the 2015–2019 change in log private employment; standard errors clustered by state. MDE: minimum detectable effect at 80% power, two-sided 5% test.
| Outcome | % per point (95% CI) | p | MDE per point | % per SD (95% CI) | n |
|---|---|---|---|---|---|
| Limited-service, employment | −0.72 (−1.49 to 0.05) | 0.066 | 1.10 | −1.10 (−2.28 to 0.08) | 1,275 |
| Limited-service, establishments | −0.37 (−1.05 to 0.32) | 0.290 | 0.98 | −0.56 (−1.61 to 0.49) | 1,275 |
| Limited-service, total wages | −0.84 (−1.62 to −0.05) | 0.037 | 1.11 | −1.28 (−2.47 to −0.08) | 1,275 |
| Full-service, employment | 0.01 (−1.08 to 1.10) | 0.984 | 1.55 | 0.02 (−1.64 to 1.67) | 1,275 |
| Full-service, establishments | −0.14 (−1.05 to 0.76) | 0.748 | 1.28 | −0.22 (−1.60 to 1.15) | 1,275 |
| Full-service, total wages | −0.14 (−1.34 to 1.06) | 0.814 | 1.70 | −0.22 (−2.04 to 1.61) | 1,275 |
| Limited minus full, employment | −0.73 (−1.94 to 0.47) | 0.227 | 1.71 | −1.12 (−2.95 to 0.72) | 1,275 |
| Limited minus full, establishments | −0.21 (−1.29 to 0.87) | 0.697 | 1.53 | −0.32 (−1.96 to 1.32) | 1,275 |
| Limited minus full, total wages | −0.69 (−1.89 to 0.51) | 0.254 | 1.71 | −1.05 (−2.89 to 0.78) | 1,275 |
| Pharmacies, employment (positive control) | −1.04 (−2.44 to 0.37) | 0.145 | 2.00 | −1.57 (−3.71 to 0.56) | 985 |
| Accommodation, employment (placebo) | 1.27 (−0.33 to 2.88) | 0.118 | 2.29 | 1.92 (−0.50 to 4.35) | 1,169 |
| Grocery, employment | −0.001 (−1.68 to 1.67) | 0.999 | 2.38 | −0.002 (−2.34 to 2.34) | 630 |
3.3 Event study
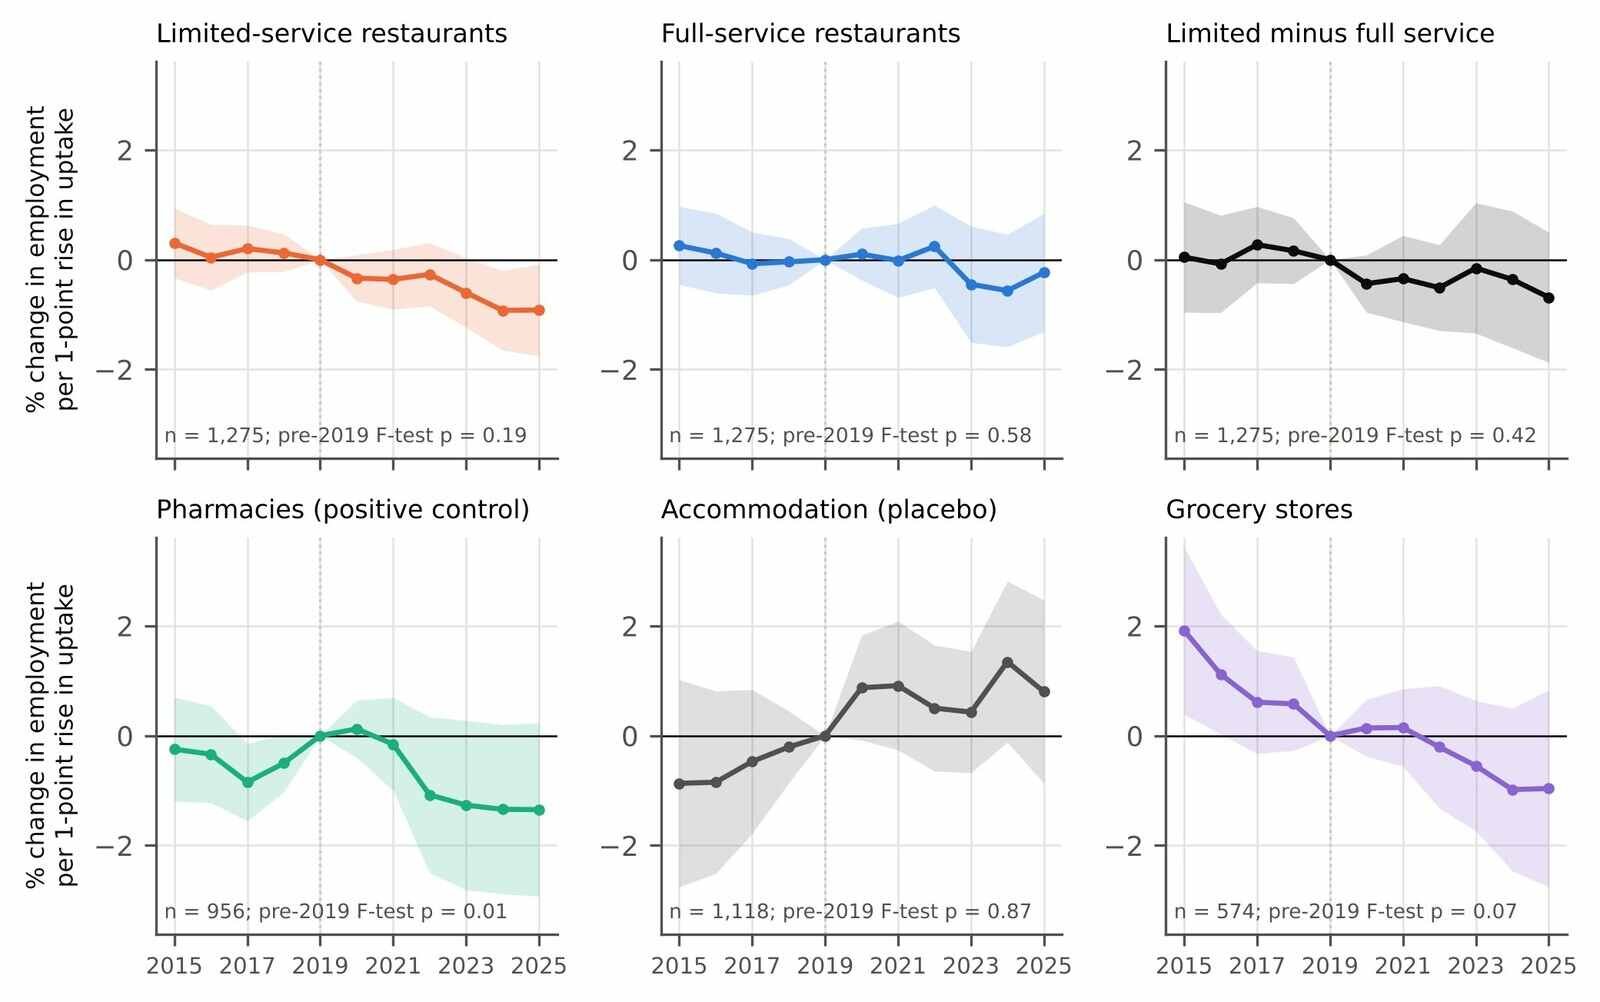
The limited-service coefficients for 2015–2018 were small and positive, between 0.05% and 0.30% per point, and the joint test did not reject zero (p = 0.19) (Figure 2). Positive pre-period coefficients mean that relative limited-service employment in high-uptake counties was already drifting down mildly before 2019. The decline steepened afterwards: −0.33% in 2020, −0.60% in 2023, and −0.92% in both 2024 (95% CI −1.65 to −0.20) and 2025 (−1.75 to −0.08). The full-service coefficients stayed within ±0.6% throughout (pre-trend p = 0.58). The coefficients for the limited-minus-full contrast were negative from 2020 but never distinguishable from zero (pre-trend p = 0.42).
The comparison industries were less reassuring. In the pharmacy positive control, relative employment in high-uptake counties rose into 2019 (pre-period coefficients −0.25% to −0.85%) and fell afterwards (−1.08% in 2022, −1.35% in 2025), and the pre-trend test rejected (p = 0.012). Grocery employment had a steady downward relative trend across the whole period (pre-trend p = 0.068). In the long differences the pharmacy estimate was −1.04% per point (−2.44 to 0.37), opposite in sign to the expectation but well within noise, and grocery was −0.001% (−1.68 to 1.67). The accommodation placebo was 1.27% (−0.33 to 2.88); its pre-period coefficients rose from −0.87% to zero, but the pre-trend test did not reject (p = 0.87).
3.4 Robustness
The negative limited-service estimate depended on how counties were weighted (Table 3). Weighted by 2019 limited-service employment, so that larger markets count more, it was 0.02% (−0.62 to 0.66). Without controls it was −0.65% (−1.30 to −0.001; p = 0.050). With 2024 rather than 2025 as the end year it was −0.79% (−1.46 to −0.12). Restricting the exposure to semaglutide and tirzepatide gave −0.76% (−1.64 to 0.11), and leaving it unwinsorised gave −0.56% (−1.35 to 0.22). Restricting to counties with at least 5,000 enrollees gave −0.82% (−1.68 to 0.04), and dropping the top decile of 2019 uptake gave −0.71% (−1.66 to 0.24). Nine of the ten limited-service specifications in Table 3 gave a negative estimate; the exception was the weighted one.
With the prescriber-based claims share as the exposure (standard deviation 2.84 claims per 1,000), the limited-service estimate was −0.15% per unit (−0.49 to 0.19). Full-service employment was 0.57% (0.07 to 1.06), and the limited-minus-full contrast was −0.72% (−1.30 to −0.14; p = 0.017). This exposure correlates only 0.42 with the main one, so it measures something partly different. Prescriber-based exposure picks up where prescribing clinics are located, and clinics cluster in service centres.
Table 3. Robustness of the employment estimates. Percentage change per 1-point rise in uptake (95% CI); for the claims-share exposure the unit is one GLP-1 claim per 1,000 Part D claims (SD 2.84). n in brackets. The pre-trend row tests the four 2015–2018 event-study coefficients jointly (state-clustered F test).
| Specification | Limited-service | Full-service | Limited minus full | Pharmacies | Accommodation |
|---|---|---|---|---|---|
| Main specification | −0.72 (−1.49 to 0.05) [1,275] | 0.01 (−1.08 to 1.10) [1,275] | −0.73 (−1.94 to 0.47) [1,275] | −1.04 (−2.44 to 0.37) [985] | 1.27 (−0.33 to 2.88) [1,169] |
| State fixed effects only | −0.65 (−1.30 to −0.001) [1,275] | −0.79 (−1.59 to 0.01) [1,275] | 0.14 (−0.81 to 1.09) [1,275] | −0.88 (−1.63 to −0.14) [1,007] | −0.08 (−1.54 to 1.37) [1,179] |
| Weighted by 2019 employment | 0.02 (−0.62 to 0.66) [1,275] | 0.23 (−0.95 to 1.42) [1,275] | −0.16 (−1.17 to 0.85) [1,275] | −1.83 (−4.24 to 0.59) [985] | 0.81 (−1.22 to 2.84) [1,169] |
| Outcome 2019–2024 | −0.79 (−1.46 to −0.12) [1,275] | −0.38 (−1.43 to 0.68) [1,275] | −0.41 (−1.67 to 0.84) [1,275] | −0.68 (−2.07 to 0.71) [1,002] | 1.82 (0.42 to 3.21) [1,172] |
| Exposure: semaglutide and tirzepatide only | −0.76 (−1.64 to 0.11) [1,275] | 0.19 (−1.03 to 1.41) [1,275] | −0.96 (−2.39 to 0.47) [1,275] | −1.06 (−2.45 to 0.33) [985] | 1.26 (−0.64 to 3.17) [1,169] |
| Exposure: GLP-1 share of all Part D claims (per 1,000) | −0.15 (−0.49 to 0.19) [1,275] | 0.57 (0.07 to 1.06) [1,275] | −0.72 (−1.30 to −0.14) [1,275] | 0.02 (−0.51 to 0.55) [985] | 0.29 (−0.45 to 1.02) [1,169] |
| Exposure not winsorised | −0.56 (−1.35 to 0.22) [1,275] | −0.003 (−1.05 to 1.05) [1,275] | −0.56 (−1.60 to 0.49) [1,275] | −0.71 (−1.98 to 0.56) [985] | 0.42 (−1.05 to 1.88) [1,169] |
| Counties with ≥5,000 Part D enrollees | −0.82 (−1.68 to 0.04) [1,090] | −0.32 (−1.45 to 0.82) [1,090] | −0.48 (−1.84 to 0.87) [1,090] | −1.04 (−2.50 to 0.41) [937] | 1.87 (−0.04 to 3.77) [1,039] |
| Excluding top decile of 2019 uptake | −0.71 (−1.66 to 0.24) [1,147] | 0.39 (−0.94 to 1.71) [1,147] | −1.10 (−2.70 to 0.51) [1,147] | 0.60 (−1.07 to 2.27) [867] | 1.50 (−0.50 to 3.49) [1,048] |
| Adding 2019–2025 private employment growth | −0.58 (−1.27 to 0.11) [1,275] | 0.18 (−0.86 to 1.23) [1,275] | −0.77 (−1.96 to 0.43) [1,275] | — | — |
| Per SD of exposure, main specification | −1.10 (−2.28 to 0.08) | 0.02 (−1.64 to 1.67) | −1.12 (−2.95 to 0.72) | −1.57 (−3.71 to 0.56) | 1.92 (−0.50 to 4.35) |
| Pre-2019 event-study coefficients, joint F-test p | 0.194 | 0.585 | 0.421 | 0.012 | 0.870 |
3.5 State card spending
Across 51 states, card spending on accommodation and food services rose by a mean of 5.3% in log terms from 2022 to 2025. A 1-point rise in state Part D uptake over 2022–2024 was associated with 0.54% (95% CI −2.55 to 3.64; p = 0.73) higher growth, with a minimum detectable effect of 4.4%. This analysis has little power and combines restaurants with hotels, so it adds little.
4. Discussion
4.1 What the estimates show
In 1,275 US counties, limited-service restaurant employment grew slightly less where GLP-1 uptake in Medicare rose faster. The point estimate was −0.72% per point, and the interval included zero. The sign was stable: limited-service estimates were negative in nine of ten specifications, the 2024 and 2025 event-study coefficients excluded zero, and the prescriber-based exposure gave a significant negative limited-minus-full contrast. In the event study, a mild relative decline that was already present before 2019 steepened afterwards, while full-service employment showed no pattern. That is the direction the household evidence predicts (Hristakeva et al., 2026), but several things argue against reading it as an effect. The estimate falls to zero when larger restaurant markets are weighted more heavily. Its size moves with the choice of exposure, and the pre-2019 drift means part of the later decline may be a continuing trend. And the positive control fails: relative pharmacy employment rose in high-uptake counties before 2019 and fell after it. A rise followed by a fall points to county-specific shocks or reversion to the mean that the controls do not capture, and such shocks could affect restaurants too. I did not investigate their source.
The more useful result concerns size. Scaling the household estimate to counties suggests that a 1-point rise in uptake would lower limited-service spending by about 0.08% to 0.32%. The 95% intervals here run from −1.49% to 0.05% for limited-service employment and from −1.94% to 0.47% for the limited-minus-full contrast. The household-scaled values lie well inside both. The minimum detectable effect for limited-service employment, 1.10% per point, is 3.4 to 13.7 times the benchmark. Under the design’s assumptions, effects more negative than about −1.5% per point, 4.7 to 18.6 times the benchmark, are inconsistent with the data. Given the failed positive control and the sensitivity to weighting, even that bound should be read cautiously. The data cannot tell an effect of the size the household panels imply from no effect at all. Read this way, the results neither confirm nor contradict the household evidence; they show that this kind of public county data is too coarse to test it.
The same arithmetic puts the national stakes in proportion. Part D uptake rose by 3.4 points between 2019 and 2024. Multiplied by the benchmark, that is a decline of 0.3% to 1.1% in limited-service spending, before any substitution toward other meals. That calculation is mine, rests on the assumptions in §2.5, and covers Part D uptake only. It uses the complete national file; uptake measured from the prescriber-level extract rose by less (a mean of 3.24 points across sample counties).
4.2 Relation to earlier work
Resendiz (2026) found no association for Medicaid coverage or total Medicaid GLP-1 spending, but found negative associations between Zepbound spending and fast-food establishments and employment, stronger when spending was scaled per enrollee, and reads them as early evidence of an effect. The negative, imprecise limited-service estimates here point the same way without being decisive, so the two studies neither confirm nor contradict each other. Like that thesis, this paper relies on administrative prescribing in one public program and on industry employment statistics. It differs in using counties rather than states, Medicare rather than Medicaid, a direct contrast with full-service restaurants, and an explicit power calculation. Neither design can confirm or refute the household estimates. Bina and Tonsor (2026) report that, in a cross-section, users ate meals from fine-dining and casual restaurants more often than non-users and, to a lesser extent, from quick-service restaurants too. A shift from limited-service to full-service eating would appear here as a negative limited-minus-full contrast. The contrast was negative but imprecise with the main exposure, and significant only with the prescriber-based one, so I can say nothing firm about substitution.
For full-service restaurants, the estimates are centred on zero. Employment in full-service restaurants fell over the period in the sample as a whole, but not more where GLP-1 use rose faster. As an operator of a full-service diner, I note that this is the result I would prefer, and I have tried to report it no more confidently than the intervals allow.
4.3 Limitations
The exposure is a narrow proxy. Part D covers people aged 65 and over, some disabled people and people with end-stage renal disease, and by law it could not cover drugs used for weight loss; plans could cover Wegovy for its cardiovascular indication only from March 2024 (Cubanski & Neuman, 2024). Part D fills over this period therefore probably reflect mostly diabetes treatment in older adults. Use through commercial insurance, Medicaid, cash payment and compounded products is not seen; in my judgement much of the recent growth in use for weight loss came through these routes, but I have not quantified it. If Part D uptake is only weakly related to all-ages uptake, the estimates are attenuated and say little about all-ages use. Fills are placed where the prescriber is, not where the patient lives. The prescriber-level file omits rows with fewer than 11 claims, and its coverage of national fills rose from 72.9% to 88.5%; summed county totals were 0.70 to 0.87 of the CMS state totals. The resulting error in the change in uptake probably depends on prescriber size and county type, so it need not be classical and could bias the estimates in either direction, not only toward zero.
The outcomes are employment, establishments and wages, not sales. Restaurants can absorb a fall in demand through hours, prices and menus before they cut jobs, so the employment response could be smaller than the spending response. Restaurant employment from 2020 to 2022 was dominated by the pandemic and its recovery, and the event-study coefficients for those years should be read with that in mind. QCEW suppression removed more than half of the counties with enough enrollees, mostly small ones; the sample covers most enrollees but not most counties. Twelve outcomes and several robustness checks were examined, so isolated intervals that exclude zero are expected by chance. The comparison across counties identifies differences in growth, not the national effect. The positive control failed its pre-trend test, which weakens the case that the design isolates GLP-1 exposure from other local trends; it had little power to pass on its sign. Finally, the benchmark depends on an assumed mapping, m, from Part D uptake to household uptake, for which I have no direct evidence.
5. Conclusion
Public county data from 2015 to 2025 show no clear association between growth in Medicare GLP-1 prescribing and restaurant employment, establishments or wages. Limited-service estimates were consistently negative across specifications, and the prescriber-based exposure gave a significant negative limited-minus-full contrast (−0.72% per unit, p = 0.017). But the main estimate was not statistically significant, it vanished when larger markets were weighted more, and the positive control failed its pre-trend test. Even taking the design at face value, it could detect only effects several times larger than the household evidence implies. The answer to whether GLP-1 drugs have reduced restaurant jobs is not “no” but “not detectable with these data”. A sharper test would need local data on all-payer GLP-1 use, or restaurant sales rather than employment.
Related on x9m8
- Eating less of the same: modelled nutrient gaps on GLP-1 drugs, paper 9 in the Research Papers series
- Eating less, eating differently: the cost of an adequate diet on GLP-1 drugs, paper 10
- Open Questions: a series on what science and law have not settled
Acknowledgements
The author thanks the Centers for Medicare & Medicaid Services, the Bureau of Labor Statistics, the US Census Bureau and Opportunity Insights for making their data public. Claude (Anthropic; model claude-opus-5-5) assisted with data retrieval, analysis code, literature search and drafting in October 2026, as described in §2.7. The author reviewed all outputs and is responsible for the content.
Author contributions
P.K. conceived the study, directed the analysis, and reviewed and approved the manuscript.
Financial support
This research received no specific grant from any funding agency, commercial or not-for-profit sector.
Conflicts of interest
The author operates The Heritage Diner, a full-service restaurant in Mount Sinai, New York. Full-service restaurants are one of the two industries studied, and the author has a commercial interest in how GLP-1 drugs affect restaurant demand. The author has no financial interest in any pharmaceutical company, GLP-1 product or restaurant chain. The author also owns Marcellino NY, a maker of leather briefcases, which is unrelated to this topic.
Research transparency and reproducibility
All data are public: CMS Medicare Part D prescriber files and Medicare Monthly Enrollment (data.cms.gov), BLS QCEW (data.bls.gov), the 2020 Census ZCTA-to-county relationship file (census.gov) and the Opportunity Insights Economic Tracker (GitHub, commit 8048afb). Code, result files and a list of input files with their sizes and hashes are in the reproducibility package linked from the article page. The raw files are not redistributed and can be downloaded with the package’s fetch script. The analysis was not preregistered.
References
Bina, J. D., & Tonsor, G. T. (2026). Meal location and protein choices of GLP-1 users. Journal of Agricultural and Applied Economics. Advance online publication. https://doi.org/10.1017/aae.2026.10049
Bloom, H. S. (1995). Minimum detectable effects: A simple way to report the statistical power of experimental designs. Evaluation Review, 19(5), 547–556. https://doi.org/10.1177/0193841X9501900504
Cameron, A. C., & Miller, D. L. (2015). A practitioner’s guide to cluster-robust inference. Journal of Human Resources, 50(2), 317–372. https://doi.org/10.3368/jhr.50.2.317
Centers for Medicare & Medicaid Services. (2026a). Medicare Part D prescribers – by provider and drug, data years 2019–2024 [Data set]. Retrieved October 22, 2026, from https://data.cms.gov/provider-summary-by-type-of-service/medicare-part-d-prescribers/medicare-part-d-prescribers-by-provider-and-drug
Centers for Medicare & Medicaid Services. (2026b). Medicare Part D prescribers – by provider, data years 2019–2024 [Data set]. Retrieved October 22, 2026, from https://data.cms.gov/provider-summary-by-type-of-service/medicare-part-d-prescribers/medicare-part-d-prescribers-by-provider
Centers for Medicare & Medicaid Services. (2026c). Medicare monthly enrollment [Data set]. Retrieved October 22, 2026, from https://data.cms.gov/summary-statistics-on-beneficiary-enrollment/medicare-and-medicaid-reports/medicare-monthly-enrollment
Centers for Medicare & Medicaid Services. (2026d). Medicare Part D prescribers – by geography and drug, data years 2019–2024 [Data set]. Retrieved October 22, 2026, from https://data.cms.gov/provider-summary-by-type-of-service/medicare-part-d-prescribers/medicare-part-d-prescribers-by-geography-and-drug
Chetty, R., Friedman, J. N., Stepner, M., & Opportunity Insights Team. (2024). The economic impacts of COVID-19: Evidence from a new public database built using private sector data. Quarterly Journal of Economics, 139(2), 829–889. https://doi.org/10.1093/qje/qjad048
Cubanski, J., & Neuman, T. (2024, March 22). Medicare spending on Ozempic and other GLP-1s is skyrocketing. KFF. https://www.kff.org/policy-watch/medicare-spending-on-ozempic-and-other-glp-1s-is-skyrocketing/
Hristakeva, S., Liaukonytė, J., & Feler, L. (2026). The no-hunger games: How GLP-1 medication adoption is changing consumer food demand. Journal of Marketing Research, 63(3), 427–444. https://doi.org/10.1177/00222437251412834
Montero, A., Kearney, A., Mulugeta, M., Kirzinger, A., & Hamel, L. (2025, November 14). KFF health tracking poll: Prescription drug costs, views on Trump administration actions, and GLP-1 use. KFF. https://www.kff.org/public-opinion/kff-health-tracking-poll-prescription-drug-costs-views-on-trump-administration-actions-and-glp-1-use/
Opportunity Insights. (2026). Economic Tracker: Affinity – State – Monthly (Version 8048afb) [Data set]. GitHub. Retrieved October 22, 2026, from https://github.com/OpportunityInsights/EconomicTracker
Resendiz, K. J. (2026). Do GLP-1 weight loss drugs affect fast food industry performance? Evidence from state Medicaid programs [Bachelor’s thesis, Claremont McKenna College]. Scholarship@Claremont. https://scholarship.claremont.edu/cmc_theses/4084
Roth, J. (2022). Pretest with caution: Event-study estimates after testing for parallel trends. American Economic Review: Insights, 4(3), 305–322. https://doi.org/10.1257/aeri.20210236
U.S. Bureau of Labor Statistics. (2026). Quarterly Census of Employment and Wages: County annual averages by industry, 2015–2025 [Data set]. Retrieved October 22, 2026, from https://www.bls.gov/cew/
U.S. Census Bureau. (2021). 2020 ZCTA to county relationship file [Data set]. https://www2.census.gov/geo/docs/maps-data/data/rel2020/zcta520/tab20_zcta520_county20_natl.txt
Wang, X., & Balagtas, J. (2026). The effects of GLP-1 medications on household grocery purchases [Preprint]. SSRN. https://doi.org/10.2139/ssrn.7434663




[…] “Same active ingredient”: what FDA warning letters allege about compounded GLP-1 sellers • Drive-thru dose–response: GLP-1 uptake and US restaurant employment • Eating less, eating differently: the cost of an adequate diet on GLP-1 drugs • Eating […]
[…] “Same active ingredient”: what FDA warning letters allege about compounded GLP-1 sellers • Drive-thru dose–response: GLP-1 uptake and US restaurant employment • Eating less, eating differently: the cost of an adequate diet on GLP-1 drugs […]
[…] Drive-thru dose–response: GLP-1 uptake and US restaurant employment, paper 11 […]