
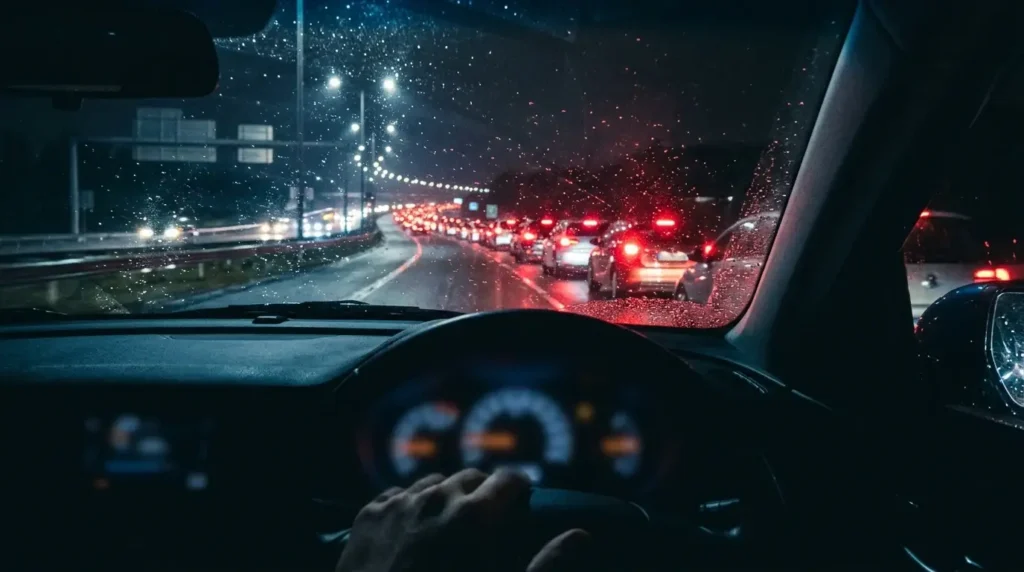
Between noon and 7 p.m. on Wednesday, November 25, a lot of drivers will brake for stoppages, and some of those stoppages will have no cause anyone can point to. The noon-to-seven window is INRIX’s worst-time forecast for the day before Thanksgiving, published by AAA on November 16, and it sits inside a week when AAA expects 72.9 million people to travel by car. Somewhere in that crowd, a line of brake lights will form, crawl, clear and form again a mile back, and nobody at the front will have hit anything.
In 2008, a team of Japanese physicists put 22 cars on a circle and watched the same thing happen with nothing in the way at all. The lesson from that track, and from a computer model built 16 years before it, is uncomfortable for anyone who has ever blamed the guy up ahead: a road can jam just from being full.
Seven days, 72.9 million cars
AAA’s 2026 count dips for the first time in four years, and the Expressway still tops the misery list
AAA’s 2026 Thanksgiving forecast puts total travel at 81.5 million people going at least 50 miles from home between Tuesday, November 24 and Monday, November 30. That is down 0.1% from 81.6 million in 2025, roughly 121,000 fewer people, and it ends a three-year run of record Thanksgiving travel that started in 2023. The car figure falls by about 200,000 from last year’s 73.1 million. Nearly 90% of holiday travelers will still go by road.
A dip of 0.1% will not be felt by anyone sitting on the Long Island Expressway.
INRIX’s corridor table in the same release puts New York to the Hamptons on the LIE eastbound at the top of the national list: peak congestion at 4:30 p.m. on Tuesday, November 24, an estimated 4 hours 15 minutes, 138% above normal. The release also says New York, Washington, Los Angeles and Boston could see more than double their usual congestion, and it names Tuesday and Wednesday as the busiest outbound days. On Wednesday the advice is plain: leave before noon.
Stacey Barber, AAA’s vice president of travel, said in the release that “Thanksgiving represents quality time with family and friends.” The quality time, for a good share of those 72.9 million, will begin in a lane that keeps stopping for no visible reason.

Twenty-two cars, 230 meters, no obstacle
The Nagoya track experiment took every excuse off the road
The experiment ran on a single-lane circuit 230 meters around. Plus Magazine’s March 2008 report describes the setup: 22 vehicles, drivers holding a constant 30 km/h at the start, traffic moving smoothly at first. Then a shock wave formed and began travelling backwards through the line, bringing some cars close to a standstill.
There was no merge. No lane ended, no toll booth sat on the circle, and nobody was rubbernecking at a fender bender, because there wasn’t one.
The result appeared on March 4, 2008, in the New Journal of Physics as “Traffic jams without bottlenecks”, with Yuki Sugiyama of Nagoya University as lead author. The abstract describes cars starting evenly spaced at the same speed, at an average density near the point where uniform flow turns unstable. Small fluctuations grew. A jam cluster formed and moved backward like a solitary wave, at about the speed jam clusters move on real highways. The authors’ conclusion is the line that gets quoted most: “a bottleneck is only a trigger and not the essential origin of a traffic jam.”
News coverage at the time, carried by ANI from New Scientist, put the backward speed of the stopped cluster at roughly 20 km/h, and reported that cars could pull out of the front of it at up to 40 km/h while new arrivals piled onto the back. Sugiyama was quoted there saying, “Although the emerging jam in our experiment is small, its behaviour is not different from large ones on highways.”
Four rules in 1992
A German model reduced every driver on the road to one line of arithmetic, and one coin flip
Long before the Nagoya track, two physicists in Germany had argued the same point with a grid of cells. Kai Nagel and Michael Schreckenberg published “A cellular automaton model for freeway traffic” in Journal de Physique I in December 1992. Their abstract reports that Monte Carlo simulations show a transition from laminar flow to start-stop waves as vehicle density rises, “as is observed in real freeway traffic.”
The road in that model is a row of cells. Each holds one car or nothing. Every second, every car obeys four rules at once, set out in a 1995 paper by Andreas Schadschneider and Schreckenberg:
- Acceleration: a car below the speed limit speeds up by one cell per step.
- Slowing down: if the gap to the car ahead is shorter than its speed, it slows to fit the gap.
- Randomization: with probability p, a moving car drops one more unit of speed.
- Motion: every car advances by its speed.
That same paper calls a cell length of 7.5 meters and a top speed of 5 cells per step the realistic choices. Lecture slides from Schadschneider’s group at the University of Cologne add that one step stands for about one second (at that rate, 5 cells per step works out to 135 km/h), and list what the random slowdown is meant to capture: “overreactions at braking,” “delayed acceleration,” road conditions and the wobble in how a person drives. The same slides make a claim worth keeping in mind for the next section: all four rules are needed to get spontaneous jams.
Rule three is the whole story. It is the driver who glances at the phone on the passenger seat, the one who lifts off the gas on a slight rise, the one who taps the brake because the car ahead did. Remove it and the model is a conveyor belt.

A ring road on a laptop
x9m8 ran the model 900 times to find where the jams start
To check that claim rather than repeat it, x9m8 wrote a short Python version of the model and ran it on a ring 1,000 cells long, or 7.5 kilometers of single-lane road. Every run began the way the Nagoya drivers did: cars evenly spaced, all at the same speed, nothing in the way. Each combination of density and p was run five times with different random seeds, for 2,000 warm-up steps and 2,000 measured steps. A “jam” was counted when at least three cars sat stopped bumper to bumper.
The results, averaged:
| Random slowdown p | Jams present most of the time from | Peak flow | Density at peak flow |
|---|---|---|---|
| 0 (perfect drivers) | never, up to 0.30 cars per cell | 2,988 cars/hour | 0.17 cars/cell (23 per km) |
| 0.10 | 0.16 cars/cell (21 per km) | 2,415 cars/hour | 0.15 (20 per km) |
| 0.25 | 0.13 cars/cell (17 per km) | 1,848 cars/hour | 0.12 (16 per km) |
| 0.50 | 0.09 cars/cell (12 per km) | 1,192 cars/hour | 0.08 (11 per km) |
With p set to zero, no jam ever formed on its own across the whole range tested. Evenly spaced, perfectly obedient cars just keep going, and the deterministic peak lands at one car per six cells, which follows straight from the rules: a car doing 5 cells per step needs 5 empty cells ahead of it.
The jam threshold and the flow peak sit almost on top of each other, and both slide lower as p rises. The road reaches its best throughput just before it starts jamming. That is cruel arithmetic for a holiday: the moment the highway is carrying the most people is the moment it is closest to breaking.
Past the peak, more cars means fewer cars delivered. At p = 0.25, raising the density from 0.12 to 0.16 cars per cell, a third more cars on the ring, cut the flow from 1,848 to 1,788 cars an hour and dropped the average speed from about 116 km/h to about 84 km/h. At p = 0.5, going from 0.08 to 0.10 cut the flow from 1,192 to 1,132. Added cars bought nothing except the privilege of sitting still together.
The case for blaming the merge
Traffic engineers have good reason to roll their eyes at a perfect circle
The circle is the experiment’s strength and its weakness. Real roads have on-ramps, lane drops, exits, tolls, weather and crashes, and the Sugiyama paper itself grants that a bottleneck is a trigger. On the LIE on a holiday afternoon, the trigger is rarely hard to find. A merge where three lanes become two will fling a disturbance backward long before random wobble gets the chance.
The randomness in the model is also open to argument. In a 1999 Physical Review E paper, Dirk Helbing and Schreckenberg himself presented a different cellular automaton whose instability comes from a deterministic mechanism, tied to the optimal velocity model of Bando and colleagues, rather than from a coin flip. That paper describes its model as easy to calibrate against measured traffic data. The disagreement is about what makes free flow fall apart, not about whether it does.
Then there is scale. The Nagoya circle held 22 cars in 230 meters, around 96 cars per kilometer at city speed. The NaSch runs above use highway settings and jam at 12 to 21 cars per kilometer. Those numbers describe different regimes and should not be laid side by side as if they measured the same road. Peak flows from the model are not forecasts for any real lane either. The value of p is a dial a modeler sets, not a measurement of Long Island drivers.
What survives all of that is narrower and harder to shake. A full road does not need a cause at the front to stop. The cause can be distributed across thousands of small, ordinary hesitations, and it only takes the road being close to its peak for those hesitations to add up.
Wednesday afternoon, by the numbers
Leaving before noon is the only advice the physics and the forecast agree on
INRIX’s guidance for November 25 is to travel before 12 p.m., and the simulation offers no secret better than that. Density is the lever. Below the threshold, wobble gets absorbed; above it, wobble gets amplified, and a single foot lifting off the gas turns into a wave that rolls backward through the next twenty cars.
Drivers do hold one dial, though, and it is the one the model calls p. Every tap of the brake that wasn’t needed, every lurch forward to close a gap that then gets closed again, pushes the same stretch of road toward the lower rows of that table. The 2008 track showed the jam moving backward at roughly 20 km/h, which means the car at the back of a holiday shockwave is braking for something that happened, minutes earlier, to people who are already gone.
The cellular automata behind this post are the same family of rules that produce Rule 30 and the Game of Life, and the same local-rule logic that turns three steering rules into a starling murmuration. The car model needs one more rule than the simulated starlings do. Its drivers also have worse reflexes and somewhere to be by six.
On the LIE at 4:30 on Tuesday the 24th, the forecast is 4 hours 15 minutes to the Hamptons. Some of that time will belong to a merge. Some will belong to nobody at all. Which part of a regular commute feels like the second kind?
Sources
- AAA Newsroom, “Thanksgiving Travel Expected to Dip Slightly Compared to Last Year” (Nov. 16, 2026): https://newsroom.aaa.com/2026/11/aaa-thanksgiving-holiday-travel-forecast/
- Sugiyama, Y. et al., “Traffic jams without bottlenecks: experimental evidence for the physical mechanism of the formation of a jam,” New Journal of Physics 10, 033001 (2008): https://iopscience.iop.org/article/10.1088/1367-2630/10/3/033001
- Plus Magazine (University of Cambridge), “Physical demonstration of mathematical traffic model” (March 25, 2008): https://plus.maths.org/news-world-maths-physical-demonstration-mathematical-traffic-model
- Oneindia / ANI, reporting New Scientist, “Shockwave traffic jam recreated on test track” (March 4, 2008): https://www.oneindia.com/2008/03/04/shockwave-traffic-jam-recreated-test-track-1204625520.html
- Nagel, K. and Schreckenberg, M., “A cellular automaton model for freeway traffic,” Journal de Physique I 2, 2221–2229 (1992): https://jp1.journaldephysique.org/en/articles/jp1/abs/1992/12/jp1v2p2221/jp1v2p2221.html
- Schadschneider, A. and Schreckenberg, M., “Cellular Automata for Traffic Flow: Analytical Results,” arXiv:cond-mat/9511037 (1995): https://arxiv.org/abs/cond-mat/9511037
- University of Cologne, Institute for Theoretical Physics, lecture slides on highway traffic (Schadschneider group): https://www.thp.uni-koeln.de/~as/Mypage/NonEq/traffic.pdf
- Helbing, D. and Schreckenberg, M., “Cellular Automata Simulating Experimental Properties of Traffic Flows,” Physical Review E 59, R2505 (1999), arXiv:cond-mat/9812300: https://arxiv.org/abs/cond-mat/9812300
- x9m8, “Cellular Automata Explained: Game of Life, Rule 30 and Rule 110, With a Simulator You Can Run”: https://x9m8.com/cellular-automata-game-of-life-rule-30-rule-110-simulator/
- x9m8, “Flocking Simulation: How Three Rules and a Predator Turn 1,200 Dots Into a Murmuration”: https://x9m8.com/flocking-simulation-boids-starling-murmuration/