
Preprint, version 1 (October 2026). Not peer reviewed. This is the author’s manuscript, prepared for submission to a peer-reviewed journal. Download: PDF · Word · reproducibility package (zip) · code on GitHub with code, results and the two independent audits.
Cite as: Kalafatis, P. (2026). Enterococcus exceedances, closures, and rainfall at New York State Park beaches on Long Island: Eleven bathing seasons at 15 OPRHP beach stations, 2015–2025 [Preprint]. x9m8.com. https://doi.org/10.5281/zenodo.24013001
Peter Kalafatis
Independent researcher, x9m8.com, New York, NY, USA. Correspondence: x9m8x7@gmail.com
Version 1, November 2026.
Abstract
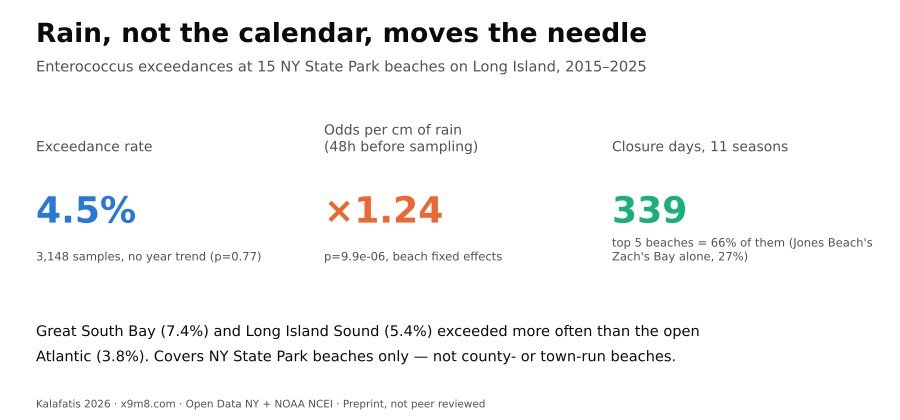
New York tests its state-park beaches for Enterococcus, the fecal-indicator bacterium used to decide whether a beach stays open. I compiled eleven seasons (2015–2025) of water-testing and status records for the 15 beach stations the New York State Office of Parks, Recreation and Historic Preservation operates on Long Island, added rainfall from the nearer of two airport stations, and forward-filled the status log into daily closure/advisory counts, excluding seasonal closures. Of 3,148 samples, 143 (4.5%) exceeded the 104 CFU/100 mL marine standard. The rate was higher in Great South Bay (7.4%) and Long Island Sound (5.4%) than along the open Atlantic (3.8%), but a beach-fixed-effects logistic regression found no year-over-year trend, overall (odds ratio 1.006/year, 95% CI 0.965–1.049, p = 0.77) or by waterbody (p ≥ 0.23). Rain in the 48 hours before sampling was strongly associated with exceedance: each centimetre raised the odds by 24% (95% CI 13%–37%, p < 0.0001), and exceedance closures were about 2.6 times as likely to follow 10+ mm of recent rain as an average sample day (49% versus 19%). Across the eleven seasons, these beaches recorded 339 closure days and 70 advisory days, concentrated at a few stations: the top five accounted for two-thirds of closure days, led by Jones Beach’s Zach’s Bay, a sheltered lagoon with the highest exceedance rate (11.3%) and over a quarter of closure days alone. This dataset covers only New York State Park beaches on Long Island from 2015 on; county- and town-run beaches and earlier years are excluded.
Keywords: Enterococcus; bathing water quality; beach closures; Long Island; New York State Parks; rainfall; fecal indicator bacteria; fixed-effects logistic regression
Social media summary: Eleven years of New York State Park beach data on Long Island: no trend in bacteria exceedances, but heavy rain reliably predicts them, and one lagoon beach drives a quarter of all closures.
1. Introduction
New York, like other coastal states implementing the federal BEACH Act, tests ocean and estuarine bathing beaches for Enterococcus, a fecal-indicator bacterium, and closes or posts an advisory at a beach when a single sample exceeds 104 colony-forming units (CFU) per 100 mL, the state’s marine standard (10 NYCRR §6-2.15(c); New York State Department of Health, n.d.). On Long Island this testing is carried out both by county health departments, for municipal and private beaches, and by the New York State Office of Parks, Recreation and Historic Preservation (OPRHP), for the beaches inside its own state parks — Jones Beach, Robert Moses, Sunken Meadow, Heckscher, Wildwood, Orient Beach and Hither Hills, among others. Rainfall is a long-established driver of such exceedances: storm runoff and combined-sewer or septic inputs raise bacterial counts in receiving waters after wet weather, a pattern documented in watersheds well beyond New York (Dwight et al., 2002) and specifically in Long Island embayments by microbial-source-tracking work from the U.S. Geological Survey, which used the same Islip-area and JFK-area rain gauges relied on here (Tagliaferri et al., 2021, 2022).
Despite this long record of individual studies, I was not able to find a public, multi-year, cross-beach description of exceedance rates, closure days, and the rainfall association specifically for Long Island’s state-park beaches using the OPRHP open-data feed, as distinct from a single embayment or a single season. This paper fills that gap for the beaches OPRHP operates, over the eleven seasons for which the agency’s public dataset carries bacteriological results and beach-status codes together (2015–2025). I ask four descriptive and modelling questions: (1) How common are single-sample Enterococcus exceedances at these beaches, and does the rate differ by waterbody (open Atlantic Ocean, Great South Bay, Long Island Sound)? (2) Is there a year-over-year trend, overall or within a waterbody? (3) Is rainfall in the day(s) before sampling associated with the odds of an exceedance, after accounting for persistent differences between beaches? (4) Which beaches, and which reasons, account for most of the closure and advisory days, and how much of that burden is rain-related? I report these as beach-fixed-effects statistical associations, not as a causal estimate of rainfall’s effect at any single beach, and I am explicit throughout about what this dataset does and does not cover (Discussion, Limitations).
2. Methods
2.1 Data sources
Bacteriological results and beach-status records came from “Beach Water Quality Testing: Beginning 2015,” a dataset OPRHP publishes through the state’s Open Data NY (Socrata) platform (dataset id wwwd-za77; New York State Office of Parks, Recreation and Historic Preservation, n.d.). I queried this dataset’s REST API on 2 November 2026 for all rows with region = "Long Island", which returned 3,301 rows for the 15 beach stations used here, spanning the 2015–2025 bathing seasons. Each row carries a sample or status date, the beach name, the water body, the Enterococcus/Enterococci result in CFU/100 mL where a sample was taken that day (the dataset’s field label changes spelling partway through the series; the two spellings refer to the same measurement and unit), the current beach_status (Open, Open with Advisory, or Closed), and, where the status is not simply “Open,” a status_reason (for example Exceedance, Weather, High waves, Preemptive: rainfall, Closed for end of season, Preseason, Lab Error). Before using the dataset I checked its Open Data NY Terms of Use (read via the dataset’s own metadata page and the platform’s standard terms), which place no restriction on reuse or redistribution and require no attribution.
Daily precipitation came from NOAA’s National Centers for Environmental Information, Global Historical Climatology Network-Daily, via the Access Data Service API (NOAA National Centers for Environmental Information, n.d.), for two long-running first-order stations: JFK International Airport (station USW00094789), assigned to the four Jones Beach State Park stations in Nassau County, and Islip-LI MacArthur Airport (station USW00004781), assigned to the eleven Suffolk County state-park beach stations (Robert Moses, Heckscher, Sunken Meadow, Wildwood, Orient Beach, Hither Hills). This is a county-level proxy for local rainfall, not a beach-specific rain gauge; see Limitations. Both series were retrieved in millimetres (units=metric) for 2000–2025, though only 2015–2025 was used in the analysis.
2.2 Classifying exceedances and building the closure timeline
A sample “exceeded” when its reported Enterococcus/Enterococci value was at or above 104 CFU/100 mL. The dataset reports a beach-status change, not a daily status, so I reconstructed a daily status timeline by forward-filling each beach’s status from one recorded change to the next (3,301 status-change rows across 15 stations). Following the dataset’s own convention, where a sample result is present on a given day, the resulting status is treated as taking effect the following day. Two status_reason values, “Closed for end of season” and “Preseason,” mark a facility as not operating that season rather than a water-quality closure of an open beach; days attributed to these reasons (8,752 day-equivalents, 466 events, mostly the off-season gap between one year’s last status entry and the next year’s first) were excluded from the closure and advisory counts reported here, and are reported separately as excluded administrative days. A day was counted as a closure day if the forward-filled status was “Closed” for a reason other than these two, and as an advisory day if the status was “Open with Advisory.” “Rain-related” events are those whose status_reason is “Weather” or “Preemptive: rainfall”; this likely understates the true rain-linked share, because some closures reasoned “Exceedance” are themselves the downstream result of a rain event (see Results, §3.4).
2.3 Statistical models
To test for a year-over-year trend while allowing persistent differences between beaches, I fit a logistic regression of exceedance (0/1) on a linear year term and beach fixed effects (C(beach)), with standard errors clustered by beach station (15 clusters), both pooled across all beaches and separately within each waterbody. As a non-parametric check, I also regressed the unweighted annual exceedance rate (11 year-level observations) on year.
To test the rainfall association, I fit a logistic regression of exceedance on cumulative rainfall at the assigned station in the 48 hours before the sample (the main specification), a linear year term, and beach fixed effects, with standard errors clustered by beach station. I report the odds ratio per centimetre of rain. Robustness specifications used same-day rainfall only, rainfall in the prior 72 hours, and the 48-hour measure without beach fixed effects. I also computed the raw exceedance rate within four rainfall bins (0 mm; >0–10 mm; 10–25 mm; >25 mm in the prior 48 hours) and, separately, the share of “Exceedance”-reasoned closures that followed at least some rain, and at least 10 mm of rain, in the 48 hours before the triggering sample, compared with the same share across all sample days (the background rate).
2.4 Software, data and AI use
Data were retrieved directly from the Open Data NY and NOAA NCEI REST APIs (both support cross-origin requests) in a browser session, without any intermediate download to disk, and analysed with Python 3.12/3.13, pandas, NumPy, SciPy and statsmodels (logistic regression via smf.logit, cluster-robust standard errors via cov_type='cluster'); figures used matplotlib. The study was carried out with the assistance of Claude (Anthropic; model claude-sonnet-5) in November 2026, which retrieved the data, wrote and ran the analysis code, searched the literature, and drafted the text under the author’s direction. Independent AI agents checked every number in this manuscript against the result files in the reproducibility package and every citation against its source. The author reviewed the work and takes full responsibility for it.
3. Results
3.1 Sample
The dataset yielded 3,148 Enterococcus/Enterococci samples with a usable result across the 15 OPRHP beach stations and 11 bathing seasons (2015–2025); nine stations front the open Atlantic Ocean (2,095 samples), two front Great South Bay (312 samples), and four front Long Island Sound (741 samples). Sampling frequency was fairly stable: a median of 19 samples per beach-season, ranging from 10 to 47 (Table 1).
3.2 Exceedance rates by waterbody, and no detectable trend
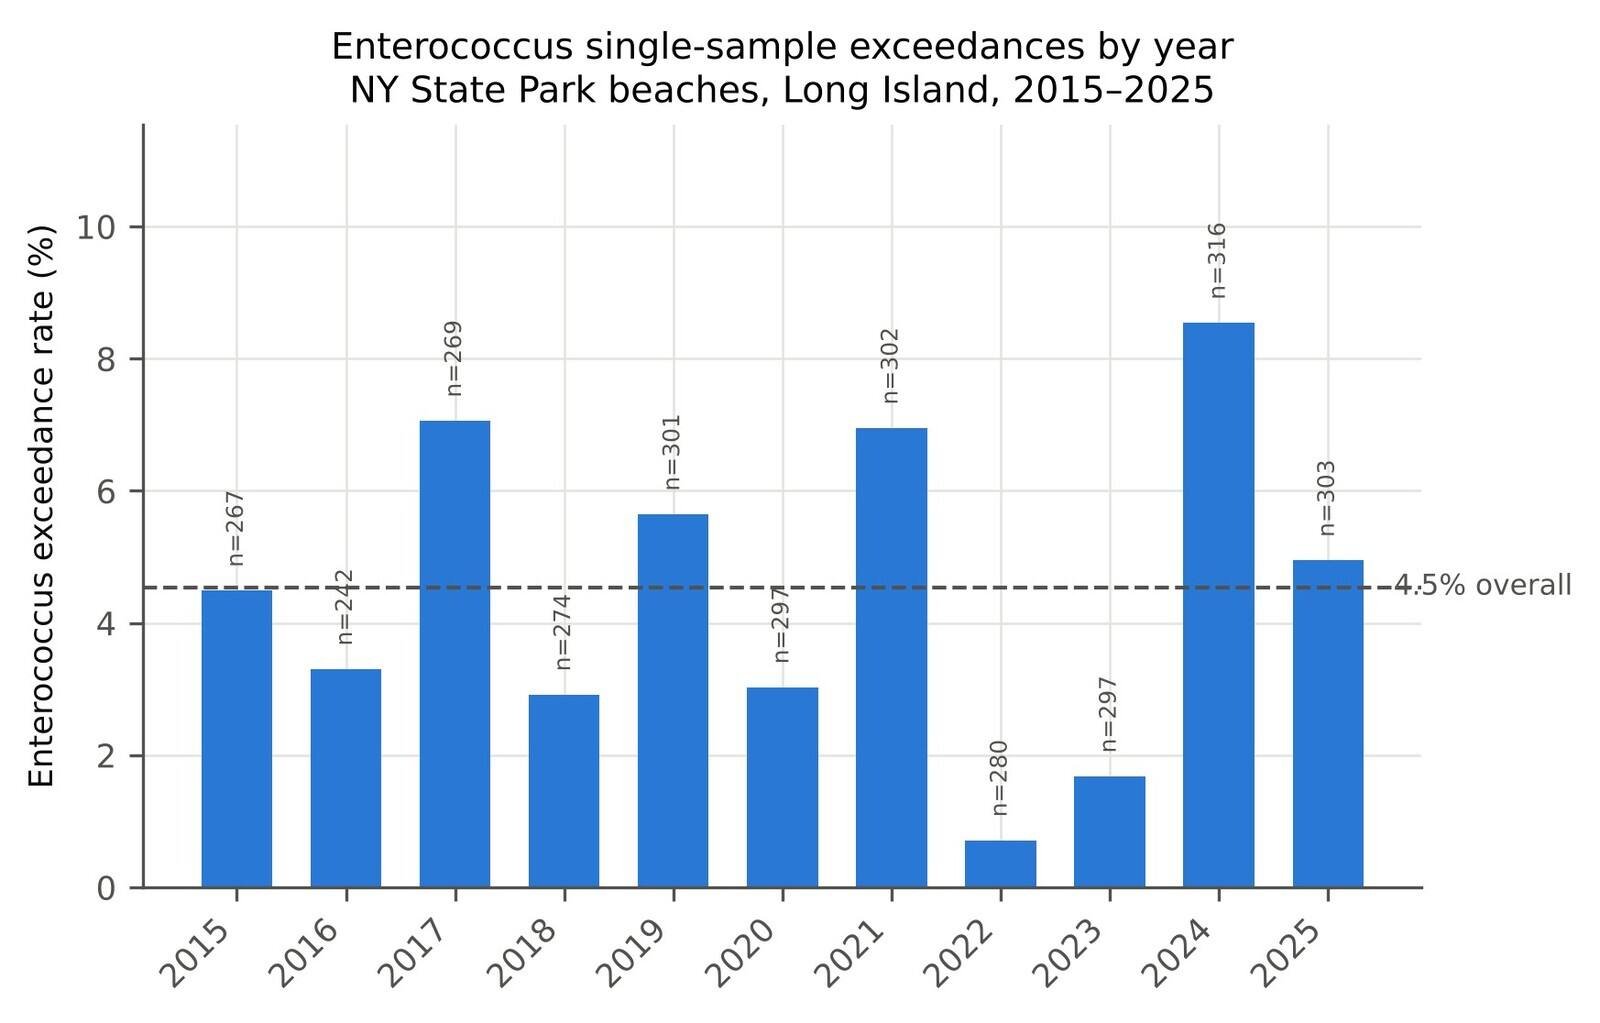
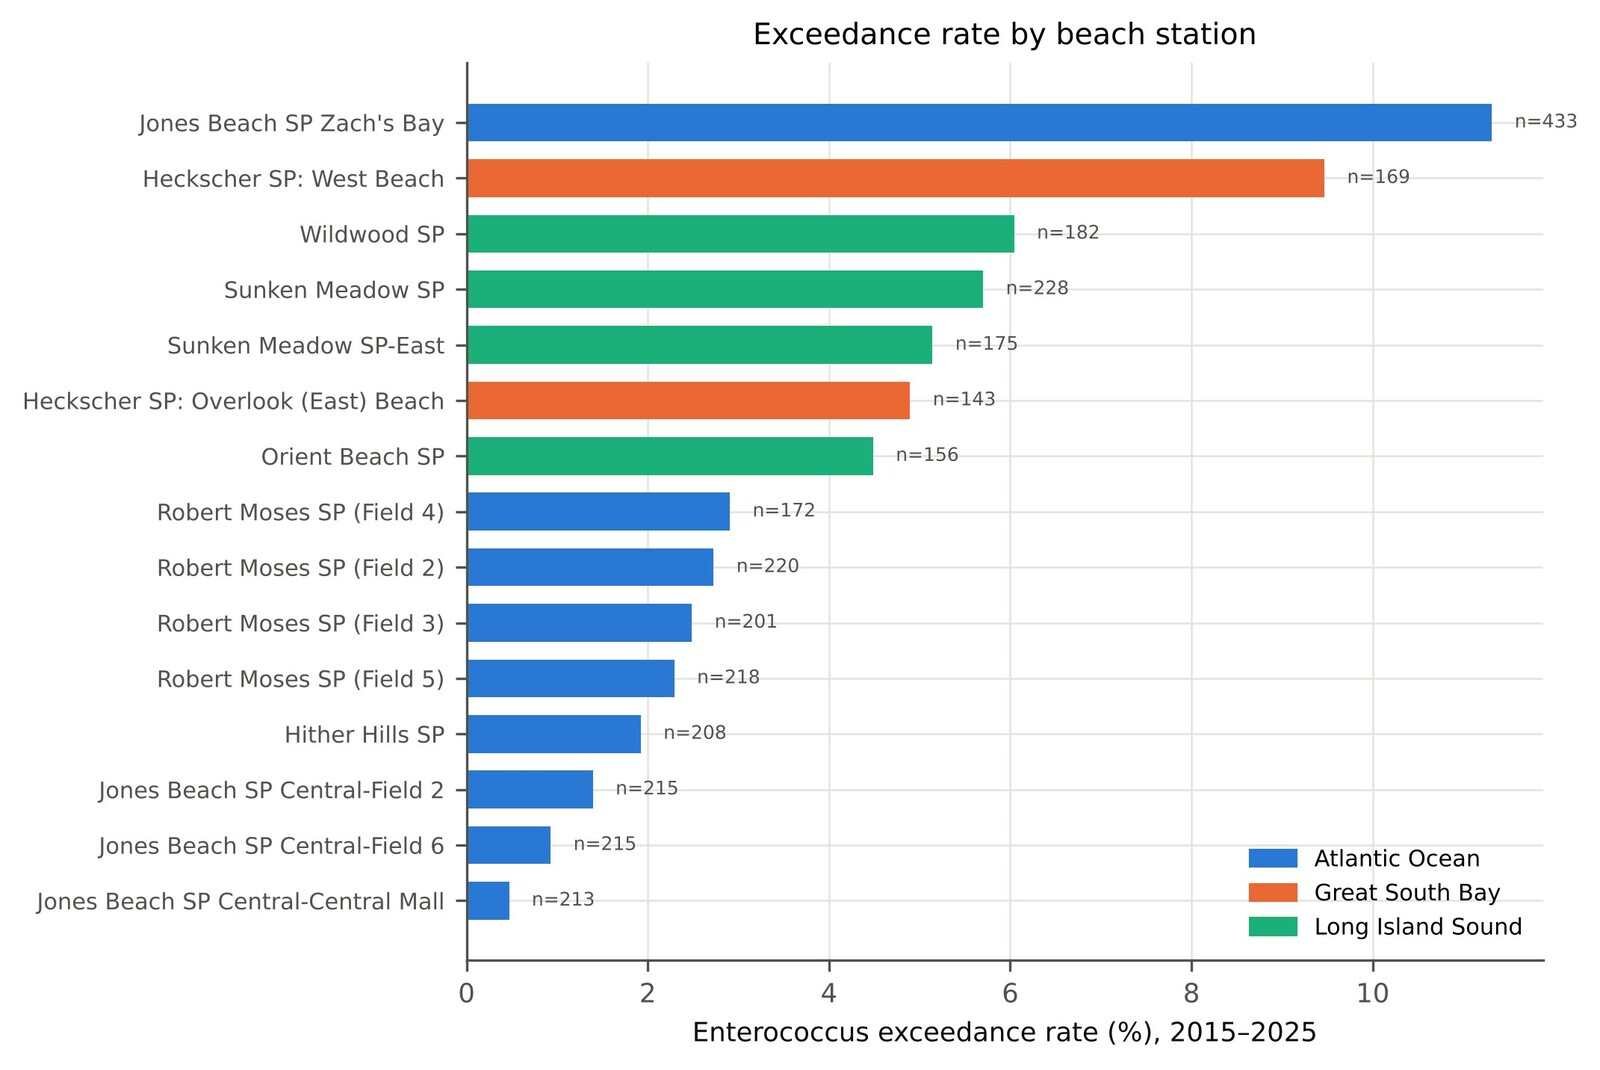
Overall, 143 of 3,148 samples (4.5%) exceeded the 104 CFU/100 mL marine standard. The rate was close to twice as high in the two enclosed or semi-enclosed waterbodies — 7.4% in Great South Bay and 5.4% in Long Island Sound — as along the open Atlantic Ocean shoreline (3.8%; Table 1, Figure 2). Annual rates varied considerably from year to year, from a low of 0.7% in 2022 to a high of 8.5% in 2024 (Figure 1), but a beach-fixed-effects logistic regression found no statistically detectable linear trend across the eleven seasons, either pooled (odds ratio 1.006 per year, 95% CI 0.965–1.049, clustered p = 0.77) or within any single waterbody (Atlantic Ocean odds ratio 1.020, p = 0.31; Great South Bay odds ratio 1.040, p = 0.65; Long Island Sound odds ratio 0.957, p = 0.23; Table 1). A simple linear check on the eleven annual rates gave the same conclusion (slope 0.05 percentage points per year, p = 0.85). The year-to-year variation visible in Figure 1 is therefore better described as noise around a flat rate than as an upward or downward trend over this period.
Table 1. Enterococcus single-sample exceedances (≥104 CFU/100 mL) by waterbody, and the year trend from a beach-fixed-effects logistic regression within each waterbody (standard errors clustered by beach station). NY State Park beaches, Long Island, 2015–2025.
| Waterbody | Beach stations | Samples | Exceedances | Rate (%) | Odds ratio per year | SE (log-odds) |
|---|---|---|---|---|---|---|
| Great South Bay | 2 | 312 | 23 | 7.4 | 1.040 | 0.086 |
| Long Island Sound | 4 | 741 | 40 | 5.4 | 0.957 | 0.036 |
| Atlantic Ocean | 9 | 2,095 | 80 | 3.8 | 1.020 | 0.019 |
| All Long Island (pooled, beach FE) | 15 | 3,148 | 143 | 4.5 | 1.006 | 0.021 (clustered) |
3.3 Rainfall and the odds of an exceedance
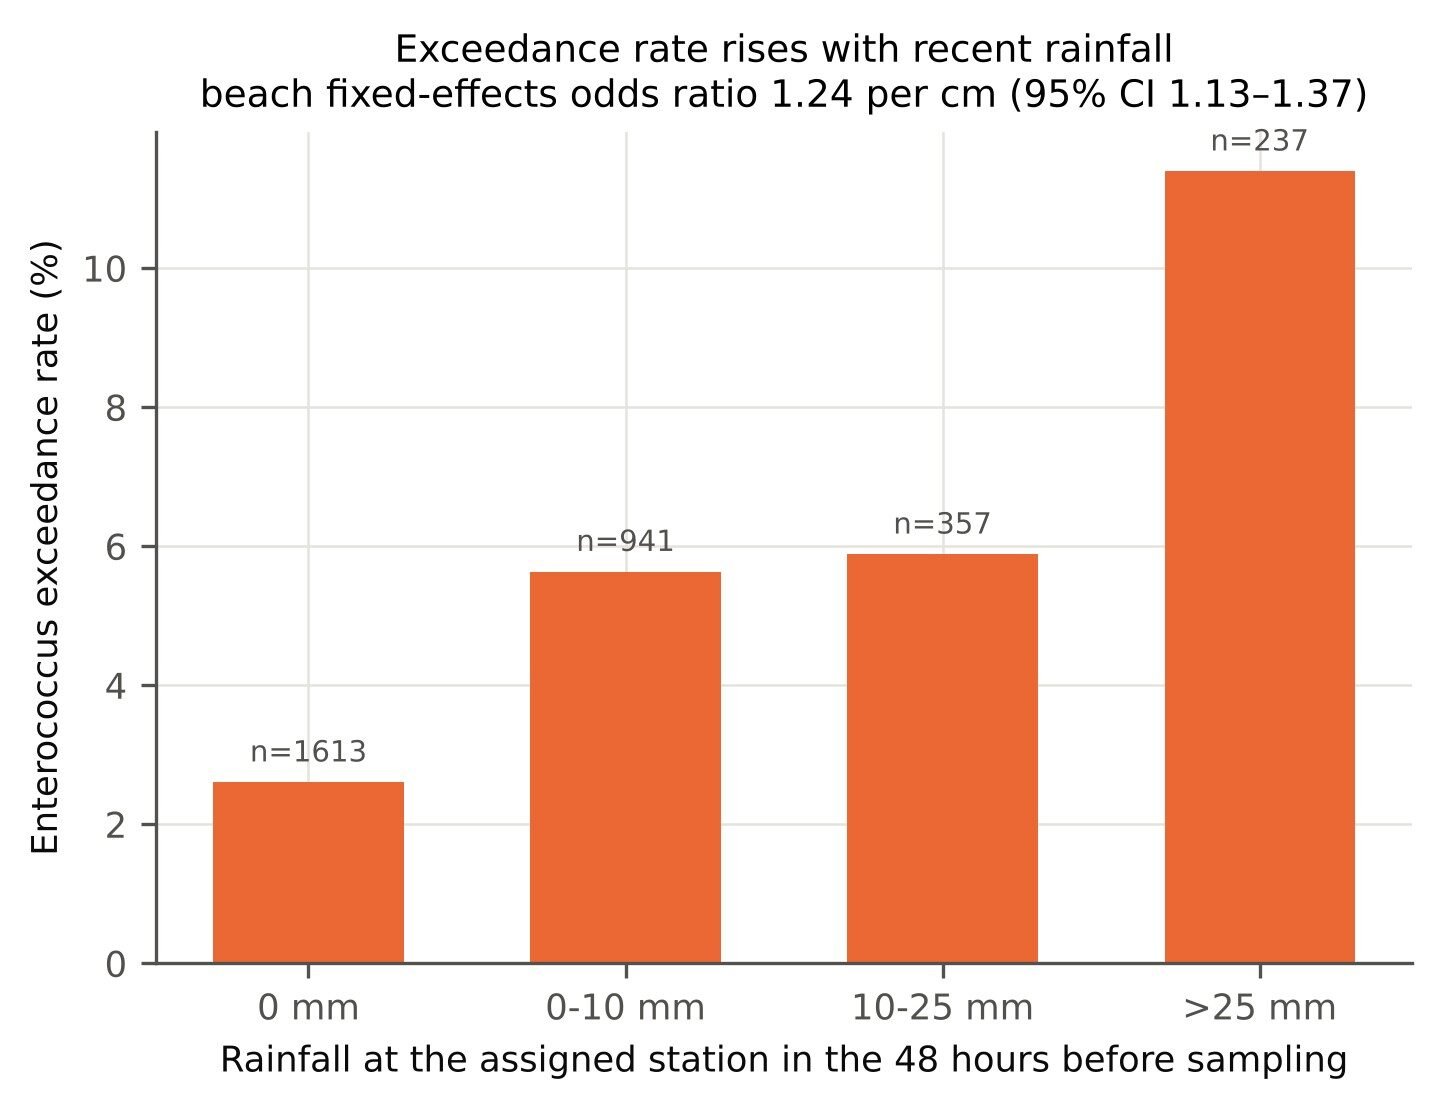
Rainfall in the 48 hours before a sample was strongly and consistently associated with a higher odds of exceedance. In the main specification (beach fixed effects, clustered standard errors), each additional centimetre of rain in that window raised the odds of exceedance by 24% (odds ratio 1.244, 95% CI 1.129–1.371, p = 9.9 × 10⁻⁶; Table 3). The association held up under alternative windows: same-day rain alone gave an odds ratio of 1.535 per cm (95% CI 1.236–1.907), and rain in the prior 72 hours gave 1.171 per cm (95% CI 1.057–1.298); dropping the beach fixed effects altogether gave a similar 48-hour odds ratio of 1.262 (95% CI 1.157–1.377), indicating the association is not an artefact of persistent differences between beaches. The association was similar in magnitude in each waterbody taken separately (odds ratio per cm: 1.27 Atlantic Ocean, 1.24 Great South Bay, 1.24 Long Island Sound), though the smaller sample sizes within Great South Bay and Long Island Sound did not support separate confidence intervals as precise as the pooled estimate. The raw exceedance rate rose from 2.6% on dry 48-hour windows (n = 1,613) to 5.6% with up to 10 mm of rain (n = 941), 5.9% with 10–25 mm (n = 357), and 11.4% with more than 25 mm (n = 237; Figure 3).
Table 3. Rainfall and the odds of an Enterococcus exceedance: logistic regression with beach fixed effects and a linear year term, standard errors clustered by beach station (n = 15 clusters). Rainfall is measured at the beach’s assigned station (JFK or Islip-LI MacArthur Airport; see Methods); odds ratios are per 1 cm of rain.
| Rainfall measure | n | Odds ratio per cm | 95% CI | p |
|---|---|---|---|---|
| Prior 48 hours (main specification) | 3,148 | 1.24 | 1.13–1.37 | 9.9e-06 |
| Same day as sampling | 3,148 | 1.54 | 1.24–1.91 | 1.1e-04 |
| Prior 72 hours | 3,148 | 1.17 | 1.06–1.30 | 2.6e-03 |
| Prior 48 hours, no beach fixed effects | 3,148 | 1.26 | 1.16–1.38 | 1.6e-07 |
3.4 Closures, advisories, and which beaches drive them
After excluding seasonal and administrative closures (8,752 day-equivalents, 466 events, mostly off-season gaps between one year’s last recorded status and the next year’s first), OPRHP’s Long Island beaches recorded 339 closure days and 70 advisory days — 409 days combined — across the eleven seasons and 15 stations, or roughly 2.5 days per beach-station per season. This burden was concentrated: the five beach stations with the most closure days accounted for two-thirds (66.4%) of all closure days (Table 2). Jones Beach State Park’s Zach’s Bay alone accounted for 90 closure days, more than a quarter (26.5%) of the total, and had both the highest exceedance rate of any station (11.3%, Table 1) and the most closure days of any station by a wide margin (the next-highest, Robert Moses State Park Field 3, had 54). Zach’s Bay is a sheltered, semi-enclosed lagoon within Jones Beach State Park; the dataset nonetheless labels its waterbody “Atlantic Ocean” along with the park’s other, directly ocean-facing stations, a categorization that likely reflects administrative grouping rather than direct wave exposure (see Limitations). Excluding Zach’s Bay, the remaining eight Atlantic-labelled stations had 162 closure days across 88 beach-seasons (1.84 per beach-season), closer to Great South Bay’s 1.73 and somewhat above Long Island Sound’s 1.11.
By stated reason, “Exceedance” accounted for the largest share of closure/advisory events (122 of 213 events, 57%, 156 days), followed by “Weather” (53 events, 105 days) and “High waves” (12 events, 34 days); “Preemptive: rainfall” accounted for a further 6 events (7 days). These named-reason categories sum to 197 of the 213 total events and 318 of the 409 total days; the remaining 16 events (91 days, 7.5% of events and 22% of days) had no status reason recorded in the source data and so are not attributed to any category here, though they are included in every other figure in this section (total closure/advisory days, by-beach and by-waterbody counts). Counting only events reasoned “Weather” or “Preemptive: rainfall” as rain-related gives 59 of 213 events (27.7%) — but this almost certainly understates the role of rain, because many exceedance-triggered closures are themselves downstream of a rain event rather than a separate cause. Of the 75 closures reasoned “Exceedance,” 76% were preceded by some measurable rain in the 48 hours before the triggering sample, and 49.3% by more than 10 mm, compared with an 18.9% background share of all sample days with more than 10 mm of rain in the preceding 48 hours — that is, an exceedance-triggered closure was about 2.6 times as likely to follow a heavy-rain window as a typical sample day.
Table 2. Closure and advisory days by beach station, 2015–2025 (forward-filled from consecutive reported status changes; seasonal/administrative closures excluded, see Methods). Ranked by total days.
| Beach station | Waterbody | Closure days | Advisory days | Total days | % of all closure days |
|---|---|---|---|---|---|
| Jones Beach SP Zach’s Bay | Atlantic Ocean | 90 | 0 | 90 | 26.5 |
| Robert Moses SP (Field 3) | Atlantic Ocean | 54 | 6 | 60 | 15.9 |
| Wildwood SP | Long Island Sound | 35 | 0 | 35 | 10.3 |
| Jones Beach SP Central-Central Mall | Atlantic Ocean | 23 | 5 | 28 | 6.8 |
| Hither Hills SP | Atlantic Ocean | 20 | 7 | 27 | 5.9 |
| Heckscher SP: West Beach | Great South Bay | 23 | 0 | 23 | 6.8 |
| Jones Beach SP Central-Field 2 | Atlantic Ocean | 15 | 7 | 22 | 4.4 |
| Robert Moses SP (Field 2) | Atlantic Ocean | 15 | 7 | 22 | 4.4 |
| Jones Beach SP Central-Field 6 | Atlantic Ocean | 16 | 3 | 19 | 4.7 |
| Robert Moses SP (Field 5) | Atlantic Ocean | 15 | 4 | 19 | 4.4 |
| Sunken Meadow SP | Long Island Sound | 7 | 12 | 19 | 2.1 |
| Heckscher SP: Overlook (East) Beach | Great South Bay | 15 | 0 | 15 | 4.4 |
| Orient Beach SP | Long Island Sound | 4 | 8 | 12 | 1.2 |
| Sunken Meadow SP-East | Long Island Sound | 3 | 7 | 10 | 0.9 |
| Robert Moses SP (Field 4) | Atlantic Ocean | 4 | 4 | 8 | 1.2 |
| Total | 339 | 70 | 409 | 100.0 |
4. Discussion
Across eleven bathing seasons, New York State Park beaches on Long Island exceeded the marine Enterococcus standard on about one sample in twenty-two, somewhat more often in Great South Bay and Long Island Sound than along the open Atlantic shoreline, with no detectable upward or downward trend over the period despite year-to-year swings of more than tenfold (0.7% to 8.5%). Rainfall in the 48 hours before sampling was the clearest systematic predictor identified here: each additional centimetre raised the odds of exceedance by about a quarter, a result that held across several alternative rainfall windows and with or without accounting for persistent differences between beaches, and that is consistent with the rainfall-runoff mechanism documented for Long Island embayments by the U.S. Geological Survey’s microbial-source-tracking studies (Tagliaferri et al., 2021, 2022) and more generally in the water-quality literature (Dwight et al., 2002; Boehm & Sassoubre, 2014). Operationally, this association is already reflected in OPRHP’s own practice of issuing a handful of preemptive rainfall-based closures each season, though the data here suggest that explicit “Weather” and “Preemptive: rainfall” reason codes capture only part of rain’s role, since roughly half of exceedance-triggered closures also followed a day with more than 10 mm of recent rain.
The closure and advisory burden was heavily concentrated at a few stations, led by a single lagoon beach, Zach’s Bay, that alone accounted for more than a quarter of all closure days across the entire dataset. This is useful for prioritizing monitoring or remediation attention, though it should be read alongside the caveat that Zach’s Bay is categorized in the source data under the same “Atlantic Ocean” waterbody label as Jones Beach’s directly ocean-facing stations despite being a sheltered lagoon, which is a feature of the dataset’s own categorization rather than this analysis’s choice, and which this paper does not attempt to correct, since the recorded waterbody label is the only information available in the source for exposure category.
A beach closure or advisory, forgone swimming by beachgoers, and any resulting effect on concession or local business revenue were outside the scope of this paper; comparable economic work exists for other U.S. beaches (Lyon et al., 2018) but was not attempted here. Likewise, the cluster-robust inference used throughout follows standard practice for a small number of clusters (Cameron & Miller, 2015) but, with only 15 beach-station clusters, should be read as indicative rather than definitive, particularly for the waterbody-specific trend and rainfall estimates, which rest on as few as two clusters (Great South Bay).
Limitations
This paper has several limitations that bound what can be concluded from it.
First, and most importantly for how the title and claims here should be read: this dataset covers only the 15 beach stations that the New York State Office of Parks, Recreation and Historic Preservation operates on Long Island. It does not cover the many beaches that Nassau County, Suffolk County, and individual towns and villages operate and test independently; I searched for a comparable public bulk dataset or API covering those beaches and did not find one with adequate historical coverage and a clean, documented schema, so they are excluded entirely. The results here describe New York State Park beaches specifically, not Long Island beaches as a whole, and should not be read as representative of the county- or town-run beaches, which may differ systematically in exposure, watershed, and sampling practice.
Second, the OPRHP dataset used here begins in 2015; I did not find a comparable OPRHP bulk source with bacteriological results extending further back, so the analysis cannot speak to years before 2015 or describe a longer-run trend.
Third, beach status is recorded as a change event, not a daily reading, so the daily closure and advisory counts reported here are a reconstruction (forward-filled from one recorded change to the next), not a direct daily record; a status change that the dataset did not capture promptly would be mis-dated in this reconstruction. I addressed the clearest source of error in this process — administrative, non-water-quality “Closed” periods at the start and end of each season — by excluding them explicitly (Methods §2.2), but more subtle timing errors in the underlying status-change log cannot be ruled out.
Fourth, rainfall is assigned at the county level, from the nearest of two airport weather stations, not measured at each beach; this is a coarse proxy for local rainfall and watershed runoff, and likely attenuates rather than inflates the true beach-level rainfall-exceedance association, since misclassified rainfall adds noise rather than a biasing pattern. The EPA BEACON database, which in principle could extend coverage and provide an independent check at the federal level, could not be accessed as a bulk export or a documented, queryable API in this round of work and was not used here.
Fifth, the waterbody labels used for the by-waterbody breakdowns are those recorded in the source dataset. As discussed above, at least one station (Zach’s Bay) is labelled with a waterbody category that may not reflect its actual, more sheltered exposure; I report the source’s labels rather than imposing my own exposure classification, which readers should bear in mind when interpreting the by-waterbody comparisons.
Sixth, the fixed-effects logistic regressions reported here characterize statistical association between rainfall and exceedance after netting out persistent per-beach differences; they are not a causal estimate of what would happen to exceedance risk if rainfall at a specific beach changed, and the number of beach-station clusters (15, or as few as 2–9 within a single waterbody) is small enough that cluster-robust confidence intervals, while standard practice, should be treated as approximate.
5. Conclusion
Over eleven bathing seasons, Enterococcus exceedances at Long Island’s New York State Park beaches ran at about 4.5% of samples, higher in Great South Bay and Long Island Sound than along the open Atlantic, with no detectable trend up or down from 2015 to 2025. Rain in the two days before sampling was the clearest predictor of an exceedance identified here, and roughly half of exceedance-triggered closures followed a day with meaningful recent rainfall. The closure burden was concentrated at a handful of beaches, led by one sheltered lagoon station. This picture is specific to the beaches New York State Parks operates; a fuller account of bathing-water quality on Long Island would need equivalent data from the county- and town-run beaches this paper could not obtain.
Related on x9m8
- Regional minimum wages and restaurant employment on Long Island, New York
- Food swamps and obesity revisited: a reproduction with public data
Acknowledgements
None.
Author contributions
Peter Kalafatis conceived the study, directed the analysis described in §2.4, and reviewed and approved the final manuscript.
Financial support
This research received no specific grant from any funding agency, commercial, or not-for-profit sector.
Conflicts of interest
The author operates The Heritage Diner (Mount Sinai, NY), Marcellino NY, and Maison Pawli. None of these businesses has any bearing on bathing-beach water quality, beach operations, or the agencies and data sources studied here, so the author declares no competing interests relevant to this paper.
Research transparency and reproducibility
All bacteriological and beach-status data are published by the New York State Office of Parks, Recreation and Historic Preservation on the state’s Open Data NY platform. The dataset carries no dataset-specific license badge (“the license for this dataset is unspecified”); it is governed instead by the platform-wide OPEN-NY Terms of Use, which grant a non-exclusive, revocable license to use the content and impose no attribution, share-alike, or pre-approval requirement, conditioned on lawful use. All rainfall data are a U.S. government work in the public domain. Both were retrieved directly from their public REST APIs; neither was downloaded to the author’s own systems, and raw/derived files are not redistributed in the accompanying reproducibility package for reasons unrelated to licensing (documented in results/provenance.md), but can be reconstructed exactly by re-running the fetch and processing code also included in the package. Every quantitative claim in this manuscript is drawn from one of five result files (descriptives.json, trends.json, rainfall.json, closures.json, rain_at_closures.json), each produced by the included analysis code and documented with a SHA-256 hash and a record of where and how it was computed; see results/provenance.md for the full chain of custody, the verbatim license text with its source URLs, and transparent records of two issues found and documented during review: an initial over-count of closure days from including seasonal/administrative closures, corrected before any number here was finalized, and a residual gap in the reason-code breakdown (§3.4) left as a disclosed limitation.
References
Boehm, A. B., & Sassoubre, L. M. (2014). Enterococci as indicators of environmental fecal contamination. In M. S. Gilmore, D. B. Clewell, Y. Ike, & N. Shankar (Eds.), Enterococci: From commensals to leading causes of drug resistant infection. Massachusetts Eye and Ear Infirmary. https://www.ncbi.nlm.nih.gov/books/NBK190421/
Cameron, A. C., & Miller, D. L. (2015). A practitioner’s guide to cluster-robust inference. Journal of Human Resources, 50(2), 317–372. https://doi.org/10.3368/jhr.50.2.317
Dwight, R. H., Semenza, J. C., Baker, D. B., & Olson, B. H. (2002). Association of urban runoff with coastal water quality in Orange County, California. Water Environment Research, 74(1), 82–90. https://doi.org/10.2175/106143002X139776
Lyon, S. F., Merrill, N. H., Mulvaney, K. K., & Mazzotta, M. J. (2018). Valuing coastal beaches and closures using benefit transfer: An application to Barnstable, Massachusetts. Journal of Ocean and Coastal Economics, 5(1), Article 1. https://doi.org/10.15351/2373-8456.1086
New York State Department of Health. (n.d.). Bathing beaches [10 NYCRR Subpart 6-2, §6-2.15]. Retrieved November 2, 2026, from https://regulations.justia.com/states/new-york/title-10/chapter-i/part-6/subpart-6-2/operation-and-supervision/section-6-2-15
New York State Office of Parks, Recreation and Historic Preservation. (n.d.). Beach water quality testing: Beginning 2015 [Data set]. Open Data NY. https://data.ny.gov/d/wwwd-za77 (retrieved November 2, 2026)
NOAA National Centers for Environmental Information. (n.d.). Global Historical Climatology Network daily (GHCN-Daily), Access Data Service [Data set]. https://www.ncei.noaa.gov/access/services/data/v1 (stations USW00094789, USW00004781; retrieved November 2, 2026)
Tagliaferri, T. N., Fisher, S. C., Kephart, C. M., Cheung, N., Reed, A. P., & Welk, R. J. (2021). Using microbial source tracking to identify fecal contamination sources in an embayment in Hempstead Harbor on Long Island, New York (Scientific Investigations Report 2021-5042). U.S. Geological Survey. https://doi.org/10.3133/sir20215042
Tagliaferri, T. N., Fisher, S. C., Kephart, C. M., Cheung, N., Reed, A. P., & Welk, R. J. (2022). Using microbial source tracking to identify fecal contamination sources in Patchogue and Bellport Bays on Long Island, New York (Scientific Investigations Report 2022-5007). U.S. Geological Survey. https://doi.org/10.3133/sir20225007
U.S. Environmental Protection Agency. (2012). Recreational water quality criteria (EPA 820-F-12-058). https://www.epa.gov/sites/default/files/2015-10/documents/rwqc2012.pdf