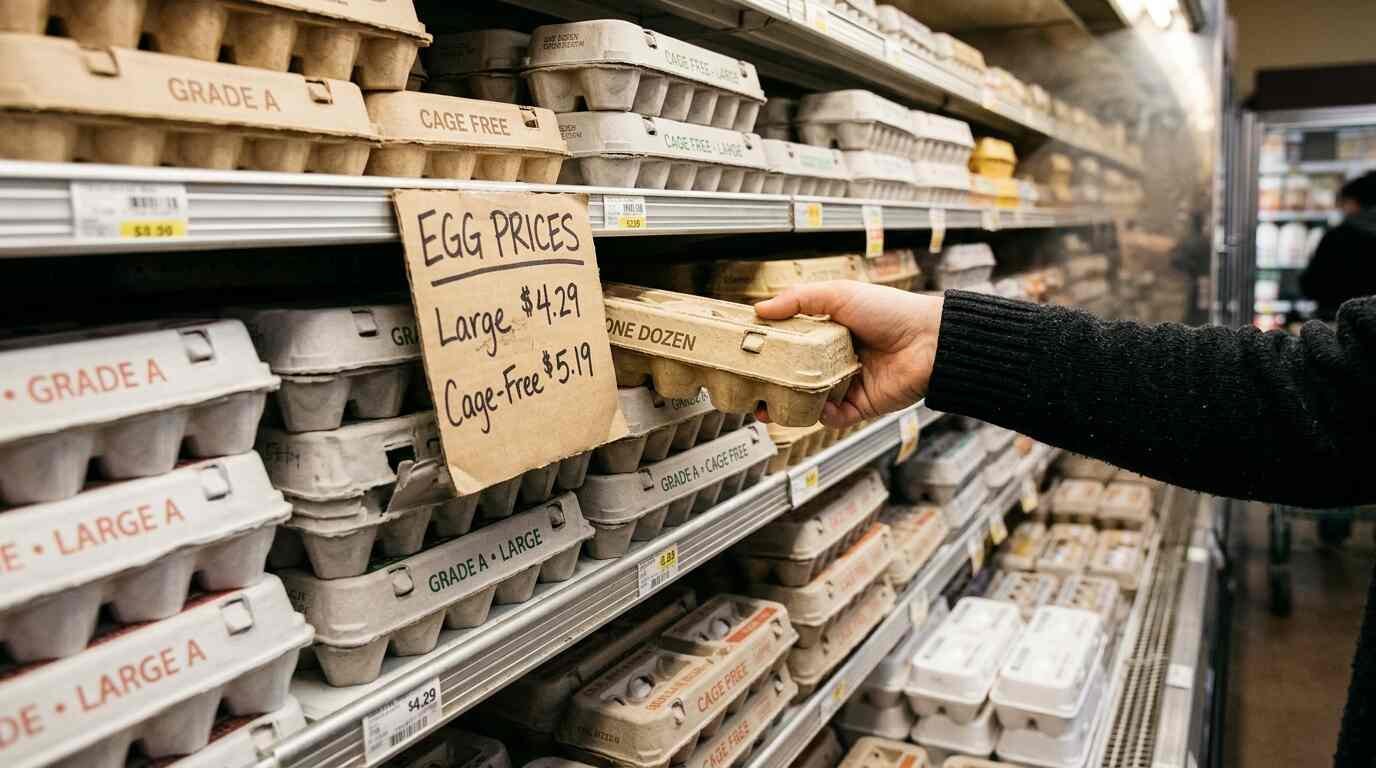

Two of the research preprints on this site report their numbers in tables. Tables are accurate and hard to play with. The Long Island Data Explorer turns them into charts you can switch on and off, with every figure traceable to the paper it came from. Nothing is added from other sources.
Want more room? Open the explorer full screen.
Tab one: the wage floor, year by year
Since 31 December 2016, New York has set a higher minimum wage on Long Island and in Westchester than in the rest of the state outside New York City. The minimum wage and restaurant employment on Long Island preprint tabulates the rates in force for most of each year from 2014 to 2026, and the first tab charts them. Toggle the general rate, the tipped cash wage and the fast-food rate for Long Island against the rest of the state, then drag the year slider to read the gap.

The table shows the gap opening at $0.30 in 2017, widening to $1.80 in 2022, then narrowing to $0.80 in 2023 and settling at $1.00 from 2024 through 2026. For 2026 the general rates are $17.00 on Long Island and $16.00 elsewhere, and the tipped cash wages are $11.35 and $10.70. The fast-food rate matched across both regions until 2024.
Tab two: restaurant jobs and pay
The second tab draws the paper’s descriptive comparison of Long Island (Nassau and Suffolk) with counties outside New York City, Long Island and Westchester. From 2016 to 2025, employment in all food services and drinking places rose 9.4 percent on Long Island and fell 4.6 percent in the comparison counties. Full-service restaurants rose 2.9 percent against a 13.0 percent fall; limited-service restaurants rose 16.6 percent against 1.6 percent.
One view is computed inside the explorer rather than copied: average weekly wage growth from 2016 to 2025, worked out from the two wage columns in the table. In full-service restaurants that is about 50.9 percent on Long Island and 55.4 percent in the comparison counties. These are descriptive figures. They do not show that the wage floor caused the difference, and the paper’s estimates, intervals and limitations are in the article itself.

Tab three: beach water and rain
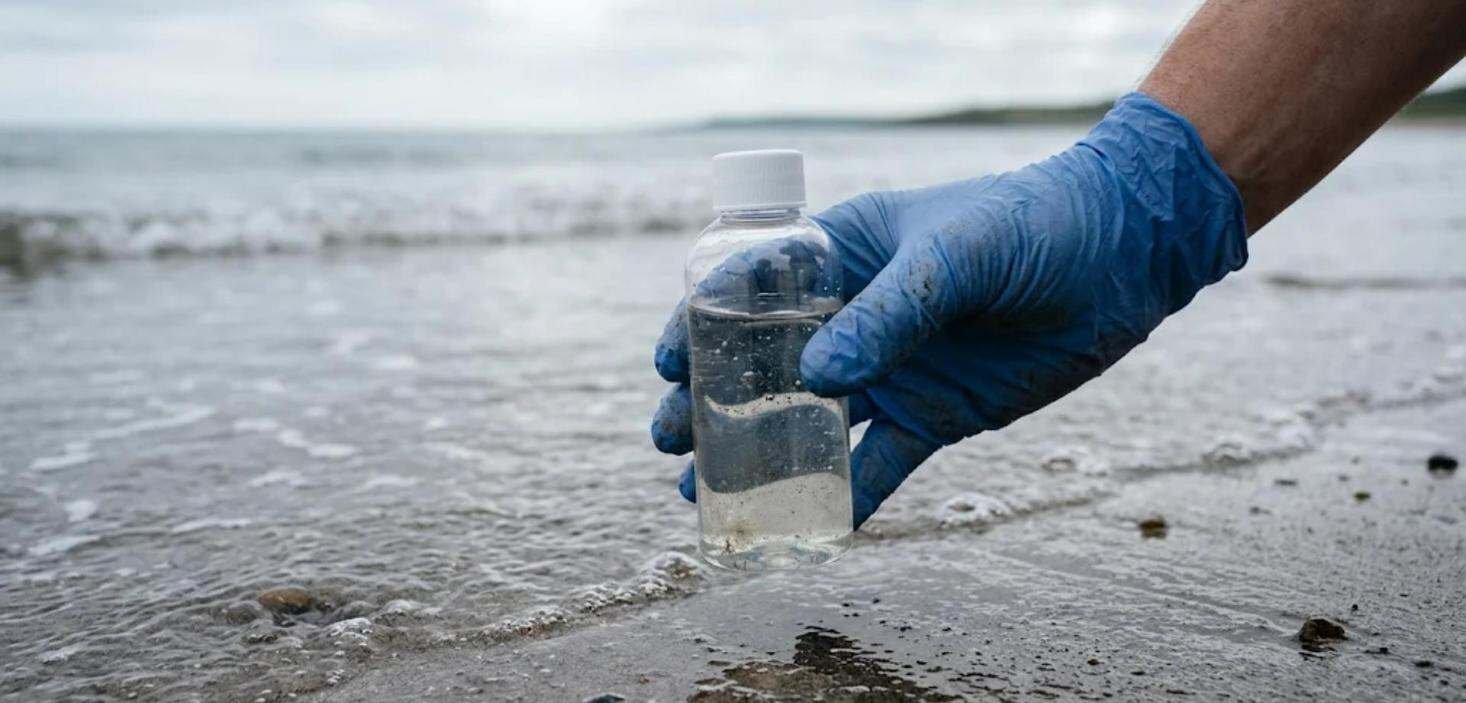
The third tab covers the Enterococcus at New York State Park beaches preprint, which compiled 2015 to 2025 water-testing records for 15 beach stations on Long Island. Of 3,148 samples, 143 (4.5 percent) were at or above the 104 CFU per 100 mL marine standard: 7.4 percent in Great South Bay, 5.4 percent in Long Island Sound and 3.8 percent on the open Atlantic. The paper found no year-over-year trend overall, with an odds ratio of 1.006 per year.
Rain mattered more. The paper reports that each centimetre of rain in the 48 hours before sampling multiplied the odds of an exceedance by 1.24, with a 95 percent confidence interval of 1.13 to 1.37. The slider on this tab simply raises that 1.24 to the power of the rainfall you choose. At 4 cm that gives a multiplier of about 2.4 on the odds. Odds are not probabilities, and the compounding extends one estimate, so read large values as an illustration of the model rather than a forecast for any particular day.
Read the papers first
The explorer is a reading aid, not a replacement. Each tab links back to its source figures in its footnote, the papers are preprints that have not been peer reviewed, and the minimum-wage paper states one conflict of interest up front: its author operates a restaurant in Mount Sinai, Suffolk County, that is subject to the wage laws studied. If you spot a number in the explorer that does not match the paper, tell me and I will fix it.
Sources
- Regional minimum wages and restaurant employment on Long Island, New York, Kalafatis, P. (2026), preprint, x9m8.com. Tables 1 and 2.
- Enterococcus at New York State Park beaches on Long Island, Kalafatis, P. (2026), preprint, x9m8.com. Table 1 and abstract.