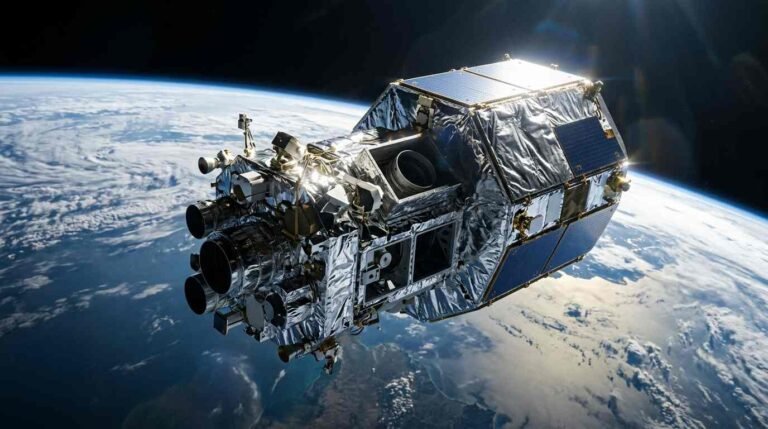





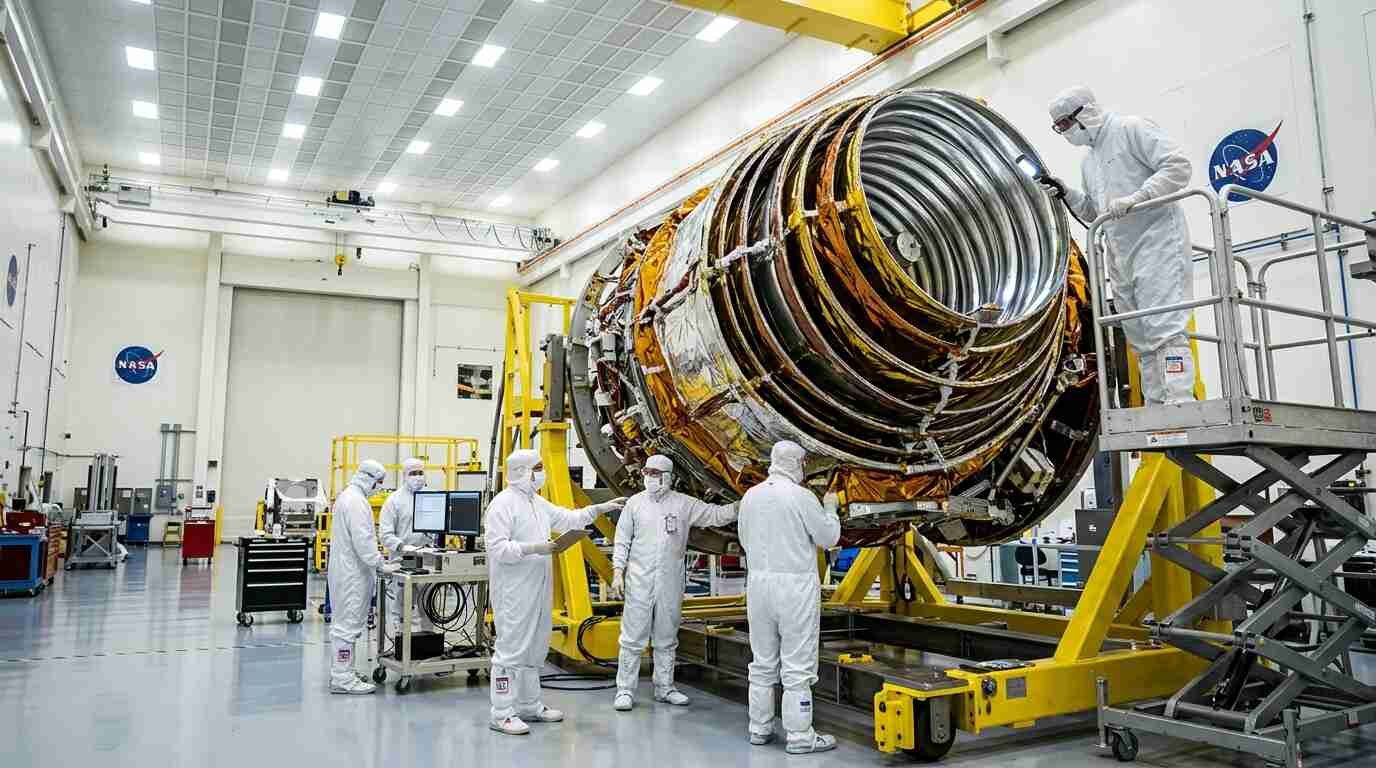
NASA's SPHEREx telescope recorded infrared spectra of 37 nearby brown dwarfs, revealing water, methane, CO and CO2 and exposing where atmosphere models still fail.
A telescope built to map the large-scale structure of the universe has turned out to be a decent tool for studying objects that barely qualify as stars. NASA’s SPHEREx, launched in March 2025, was designed for cosmology and for tracing ices in our galaxy. This month, a team led by Zafar Rustamkulov of IPAC at Caltech reported what the same data reveal about brown dwarfs, and the result is a tidy sequence of 37 spectra running from hot to nearly planet-cold.
The work is a benchmark more than a discovery announcement. It shows where current atmosphere models hold up and where they quietly fail. Below, the questions a reader would reasonably ask, answered from the NASA/JPL release and the underlying arXiv paper, with my own interpretation flagged as such.
What is a brown dwarf?
Think of an object that started the way a star does and then ran short of material. Brown dwarfs form when a cloud of gas collapses under its own gravity, but they never gather enough mass to sustain hydrogen fusion in the core. They have no host star to warm them, so they drift through space and radiate leftover heat from their formation.
NASA notes that the first were found in the 1990s. The SPHEREx paper puts the known population at roughly 10,000 objects. As they cool over time they dim and shift toward longer infrared wavelengths, which is why astronomers sort them into spectral types: L for the warmer ones, T for cooler, and Y for the coldest.
That sorting matters here. A single brown dwarf can pass through several types as it ages, so a sample spanning the whole range works like a time-lapse of one object cooling.
What did SPHEREx actually see?
The headline sample is 37 nearby brown dwarfs. According to the paper, the main sequence covers spectral types L0 through Y4, which corresponds to temperatures from roughly 2,500 K down to about 250 K. NASA expresses the same span as about 2,200 to minus 20 degrees Celsius. Distances in the sample table run from a little over 2 parsecs to about 17.5.
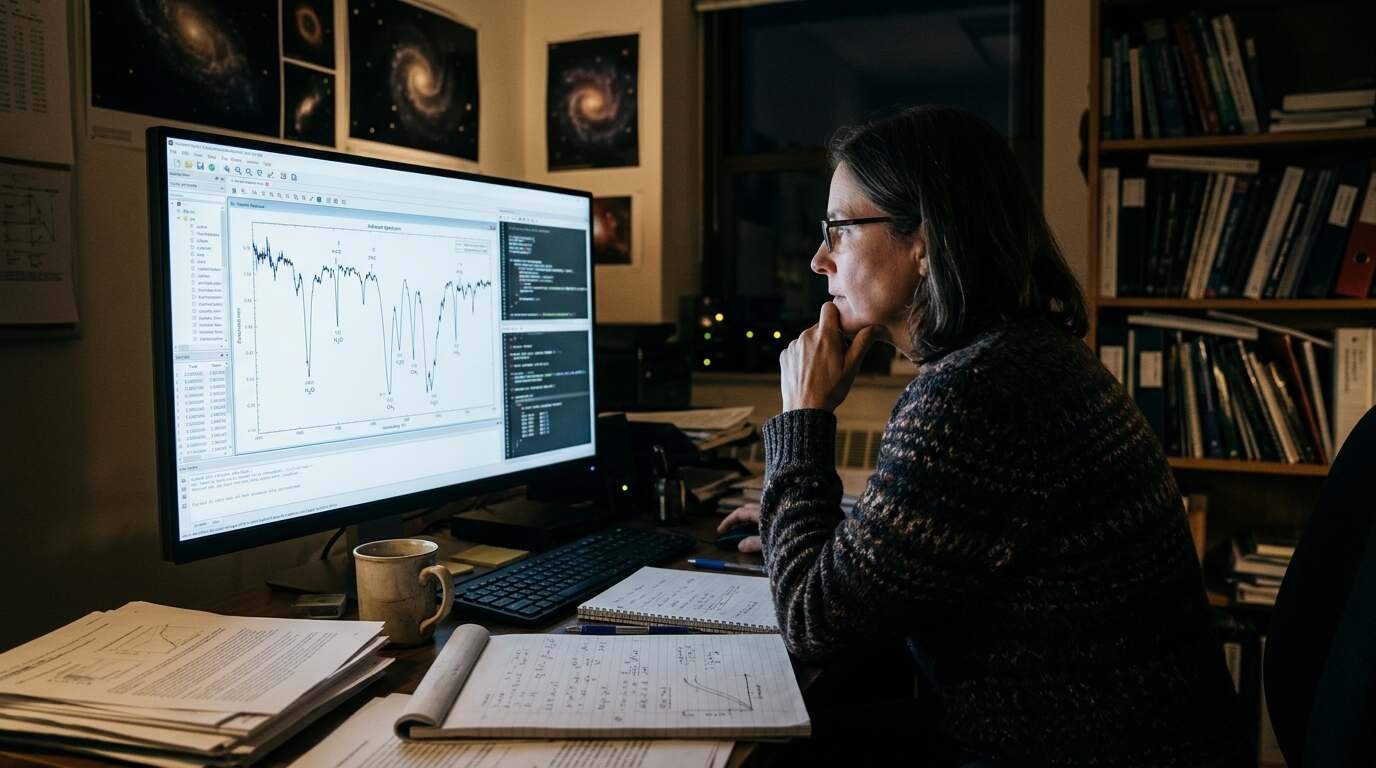
Those 37 are not all one kind. The authors break them into 24 ordinary field dwarfs, 6 low-gravity objects (generally younger) and 7 low-metallicity objects, which contain fewer heavy elements. For each, SPHEREx recorded brightness across 102 infrared colors to assemble a spectrum covering 0.75 to 5 microns.
The fitting is where the science sits. The team compared the spectra with five published model grids: Sonora Diamondback, Elf Owl, BT-Settl, ATMO2020 and ATMO2020++. The models broadly tracked the trends, including through the awkward L/T transition. They struggled to reproduce the near-infrared peaks and the 4-micron window together. Among the field dwarfs, the Elf Owl grid with weak vertical mixing fit best.
Which molecules does the data show?
NASA lists water, carbon dioxide, carbon monoxide and methane as detected in these atmospheres, and describes the chemistry as rich, comparable in character to the giant planets of our own solar system. That last comparison is NASA’s framing, and a fair one: methane-bearing, cloud-banded atmospheres are exactly what Jupiter and Saturn show.
The paper gets more specific about where each gas leaves a mark. Methane dominates the blue edge of the 4-micron window. Carbon dioxide carves a notch near 4.15 to 4.3 microns, and carbon monoxide a broader one between roughly 4.4 and 4.9. The authors built simple spectral indices around methane, carbon dioxide and carbon monoxide bands so objects can be compared on a common footing.
The Y dwarfs behave differently. In the coldest object the methane band was not detected, so those objects were left out of the index plots. For the coldest, only flux beyond about 3.9 microns was judged reliable.
Why does an all-sky infrared survey suit brown dwarfs?
Temperature is the reason. A 300 K object glows almost entirely in the infrared, and the paper says the 0.75 to 5 micron range captures upwards of 80 percent of the bolometric luminosity of most brown dwarfs. Visible-light surveys see little of that energy.
Coverage is the second reason. SPHEREx takes about 3,600 images per day and is mapping the entire sky, per NASA. Brown dwarfs are nearby and scattered everywhere, so a survey that does not choose targets in advance collects them as a by-product. NASA calls brown dwarf work a side project of the mission, and the paper says thousands have been observed.
There is also a gap-filling argument. Before SPHEREx, survey-grade data on these objects came largely from 2MASS and the first two WISE bands, which together offered a resolving power of only about 5 to 8. SPHEREx delivers roughly 40 across 0.7 to 3.8 microns and about 110 beyond that, per the paper. That is still coarse next to a lab spectrograph, yet it is enough to see broad molecular bands rather than a handful of colored points.
Interpretation, not a finding: this pairs naturally with other wide surveys. Our earlier piece on the Rubin Observatory’s ten-year southern sky survey describes a visible-light program, and cool dwarfs are faint there. Infrared all-sky spectra fill the complementary space. The same logic applies to the Roman Space Telescope, which will look deeper at smaller patches.
How does this differ from Webb?
Different tools for different jobs. Webb can take far sharper, deeper spectra of a single brown dwarf, and it does. The trade is time and area: the SPHEREx paper states that only a handful of brown dwarfs have been observed at these wavelengths with JWST and AKARI. NASA adds that only a few dozen have been studied in detail from space.
SPHEREx gives up resolution and depth to get breadth. Dozens of objects, observed uniformly by one instrument with one calibration, are rare in this field. That uniformity is what makes a model comparison trustworthy; if every spectrum came from a different telescope, offsets between instruments could masquerade as physics.
Webb’s strengths show up in other corners of the infrared sky too, such as the debris disks around young stars we covered earlier. My read is that the two facilities work as a pair: SPHEREx identifies which brown dwarfs deserve a long, expensive look, and Webb then supplies the detail.
What can’t this data tell us yet?
Quite a lot, and the authors say so. Start with the models. The paper reports that the largest mismatches cluster near the carbon dioxide and carbon monoxide features, and that most high signal-to-noise fits still have poor reduced chi-squared values, at 10 or above. NASA describes the problem as concentrated in cloudy transitions, when clouds thin out and methane-rich atmospheres emerge.
Then the data. The paper analyzes first-epoch observations only. Its calibration is reliable to about 3 percent for the shorter-wavelength bands and about 5 percent for the longer ones, and a roughly 3 percent visit-to-visit scatter was not yet folded into the error bars. Early processing under-flagged bad pixels, and at least half of the observations are affected. Nearby contaminating sources can also corrupt a measurement, so some objects were excluded.
The fits themselves have limits. The authors report only the best 10 percent of native grid models and give no formal parameter uncertainties. So the preference for weak vertical mixing is a ranking among available models, not a measured atmospheric property. That distinction matters.
Resolution is the last constraint. Fine spectral wiggles in the models often exceed what a survey at R of 40 to 110 can resolve. No one should expect SPHEREx to settle questions that need Webb-grade spectra.
What happens next?
The mission is active. NASA says the first all-sky map was finished in December 2025, with three more passes planned during the two-year primary mission. The paper counts four sweeps in a 25-month prime mission. Each pass adds visits to every object, which should help average down the scatter the authors flagged.
NASA says thousands of additional brown dwarfs are still being analyzed, and the SPHEREx dataset is freely available. The authors write that these spectra and later SPHEREx data can help improve the models. Whether the models actually improve is the open question; what exists now is a clean, uniform yardstick to measure them against.
Sources