

Preprint, version 1 (November 2026). Not peer reviewed. This is the author’s manuscript, prepared for submission to a peer-reviewed journal. Download: PDF · Word · reproducibility package (zip) · code on GitHub (link added at publication) with code, results and the two independent audits.
Cite as: Kalafatis, P. (2026). Five Technologies, One Shrinking — and Then Not-So-Shrinking — Lag: A Reproducible Look at Diffusion Speed in the CHAT Dataset [Preprint]. x9m8.com.
Peter Kalafatis (ORCID: 0009-0000-1637-7142)
Independent researcher, x9m8.com, New York, NY, USA. Correspondence: x9m8x7@gmail.com
Version 1, November 2026.
Abstract
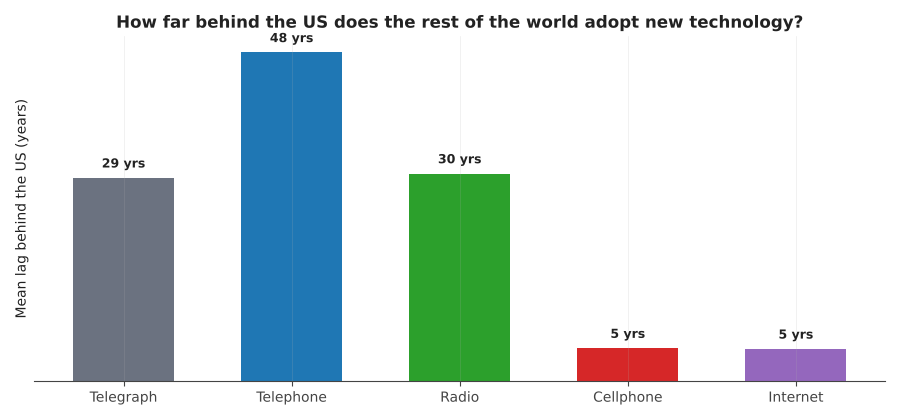
Comin and Hobijn’s Cross-country Historical Adoption of Technology (CHAT) dataset is widely cited evidence that countries adopt new technologies with a shrinking lag behind the United States. This paper re-examines that claim as a focused, fully reproducible case study on five communication technologies with strong coverage in CHAT — telegraph, telephone, radio, cellphone, and internet use — across a fixed panel of 58 countries with adequate data for all five. For each technology and country I compute the number of years between the United States first crossing a data-driven per-capita adoption threshold and each other country doing the same, then compare mean lags between 29 countries that are OECD members as of 2020 and 29 that are not, with cluster-bootstrap confidence intervals. The lag does shrink dramatically for the two most recent technologies (cellphone: 4.8 years, 95% CI 3.7–5.9; internet: 4.7 years, 95% CI 3.9–5.5) compared with the three earlier ones (telegraph: 29.5 years; telephone: 47.7 years; radio: 30.1 years). It does not, however, shrink monotonically across all five: the telephone lag is larger than both the telegraph and radio lags that bracket it historically. The OECD/non-OECD gap in absolute years also narrows with technology vintage (44 years for telegraph, 33 for telephone, 22 for radio, 5 for cellphone, 4 for internet) but is not monotonic in relative terms. These results are broadly consistent with, and offer no reason to doubt, Comin and Hobijn’s own published findings; the contribution here is a narrow, transparent, re-runnable replication case study, not a new empirical claim.
Keywords: technology diffusion; CHAT dataset; cross-country adoption lag; communication technology; reproducibility
Social media summary: Telegraph-to-internet lag behind the US shrinks dramatically for cellphone/internet, but telephone lagged more than telegraph or radio.
1. Introduction
Why do some countries adopt a new technology quickly while others take decades longer? Comin and Hobijn’s CHAT dataset — an unbalanced panel covering over 100 technologies in more than 150 countries since roughly 1800 — has been the empirical basis for a substantial literature on this question, most of it by Comin, Hobijn, and coauthors themselves (Comin & Hobijn, 2004; Comin, Hobijn, & Rovito, 2008; Comin & Hobijn, 2010). Their central, repeated finding is that the world has become faster at adopting new technology: the lag between a technology’s appearance in the lead country and its appearance elsewhere has shrunk over the past two centuries.
This paper does not attempt to overturn or extend that finding. CHAT is Comin and Hobijn’s own dataset, built specifically to study this question, and they and their coauthors have already published the foundational cross-country lag analyses using it. What this paper offers instead is a narrow, fully transparent replication-style case study: a single, pre-specified lag definition, applied consistently to five well-covered communication technologies (telegraph, telephone, radio, cellphone, internet) across a fixed, coverage-justified panel of 58 countries, with every number traceable to code and data, and an honest accounting of where the simple “lag has shrunk” story holds up and where — in this particular slice of the data — it does not.
I am not aware of a reproducible, publicly documented worked example that walks through this specific five-technology comparison end to end with cluster bootstrap inference; that is the modest gap this paper fills, not a claim to new substantive knowledge about technology diffusion.
2. Data
2.1 The CHAT dataset
CHAT (Comin & Hobijn, 2009, NBER Working Paper 15319, “The CHAT Dataset”) is available from the NBER Public Use Data Archive at nber.org/research/data/cross-country-historical-adoption-technology (DOI: 10.60592/csem-gt84), with the data file itself at data.nber.org/data-appendix/w15319/FinalCHAT_72909.csv. As retrieved for this paper (2026-11-12), the file is 6,365,505 bytes (SHA-256: 139844aaee82ce67dc54bb3038d7523a8a454909cf8eed7ecc783691348b0d75), with 113 columns (country_name, year, and 111 technology/outcome variables), 41,699 country-year rows, and 161 distinct countries, spanning 1750–2008.
I note two minor, disclosed data issues rather than silently resolving them. First, NBER’s own landing page describes CHAT as covering adoption “since 1800,” but the file itself contains a handful of electricity-production observations as early as 1750; I report the file’s actual range (1750–2008) rather than the page’s rounder description. Second, one country label in the raw file is misspelled (“Venezuala” for Venezuela); it is carried through verbatim in the results tables.
2.2 Variable definitions
Variable definitions for the five technologies used here were read directly from the data documentation (Comin & Hobijn, NBER WP 15319, Table 1), not assumed from general knowledge of the dataset:
- telegram: number of telegrams sent (source: Mitchell, 1998) — a flow (annual messages), not a stock, unlike the other four variables.
- telephone: number of mainline telephone lines connecting a customer’s equipment to the public switched network, as of year end (sources: Mitchell, 1998; World Bank, 2007).
- radio: number of radios (source: Banks, 2004).
- cellphone: number of users of portable cell phones (source: World Bank, 2007).
- internetuser: number of people with access to the internet (source: World Bank, 2007).
Because telegram measures annual traffic rather than a cumulative stock of access, its “crossing a threshold” is not directly comparable in kind to the other four, cumulative-stock variables — a point I return to in Limitations.
Per-capita intensity was computed as raw value divided by xlpopulation. Despite its “xl” prefix (suggestive of a log transform), this column is simply population measured in thousands — confirmed by comparing the United States’ 1990 value (249,984) against that year’s known population (≈249.98 million), not assumed from the variable name.
2.3 Country panel
CHAT’s coverage is highly uneven across its 111 variables: the best-covered (railline, radio, telephone) have 7,000–12,500 non-missing country-years across most of the 161 countries, while many niche variables (specific surgical procedures, loom or spindle types) have as few as 69–72 non-missing cells, confined to a handful of mostly high-income countries in a narrow recent window. Comparing all 100+ technologies across all 161 countries would therefore mostly measure differences in historical record-keeping and World Bank/NBER source coverage, not differences in diffusion speed.
To avoid that, I restrict to a fixed panel of 58 countries that have at least 8 non-missing (technology value and population both present) country-years for every one of the five chosen technologies. This is a coverage-driven selection rule, fixed before any lag or group-mean computation, not a selection on the outcome. The 58 countries are listed in results/lag_table.csv.
2.4 Income/development grouping
I group these 58 countries into OECD members as of 2020 (29 countries, including Colombia, which became the OECD’s 37th member on 2020-04-28) and non-members (29 countries), using 2020 OECD membership as a fixed, citable, and date-stable proxy for “early-industrialized / high-income,” rather than the World Bank’s income classification, which is re-assessed annually and would make the grouping itself a moving target applied retrospectively over a 200-year panel. This is an imperfect proxy and is discussed further in Limitations.
2.5 Data access and the in-browser pipeline (disclosure)
The data pipeline for this paper ran as JavaScript executed inside a real, already-authenticated Chrome browser tab (via Claude-in-Chrome), fetching the CHAT CSV directly from data.nber.org and computing the full country × year × technology panel, the per-capita series, adoption thresholds, crossing years and lags entirely in that browser session — not as a local script run against a copy of the raw file on the machine that produced this manuscript. This was necessary, not a stylistic choice: direct outbound connections from the build environment to data.nber.org, www.nber.org, datahub.io, and api.crossref.org were tested and confirmed blocked by that environment’s network policy, while a normal, already-signed-in browser session reaches these hosts with no restriction. The raw 6.1 MB CHAT file itself was hashed (SHA-256, computed in-browser before any parsing) and never copied in full to local disk; only (a) small, aggregated per-technology and per-country-group summary statistics, (b) the complete 290-row (58 country × 5 technology) table of crossing years and lags, and (c) a reduced, column-limited, modest real sample of three example countries’ time series (United States, Japan, Brazil; roughly every third observed year) were transferred out, as plain text, for the figures and tables in this paper.
This is disclosed here, in the Limitations section below, in results/provenance.md, and in audits/note_to_auditors.md, because it means that an independent reproduction of the data-to-lag-table step (as opposed to every step from the lag table onward, which is fully local, scripted, and reproducible with the code in this package) requires either re-running the same in-browser pipeline against the live NBER file, or independently downloading the CHAT file through some other channel and checking it against the lag definition below.
3. Methods
3.1 Per-capita threshold and crossing years
For each technology k, I define its adoption threshold, τ(k), as the median of all positive per-capita values observed for that technology across the 58-country panel (a data-driven, non-arbitrary, and fully reproducible choice, not tuned to produce any particular result). For each country i and technology k, I find the first year, among years actually observed in the data (no interpolation across gaps), in which country i‘s per-capita intensity for k is at or above τ(k). Three outcomes are possible and are all reported, not silently dropped:
- ok: the country’s per-capita series starts below τ(k) and later crosses it within the observed window — a usable crossing year.
- left-censored: the country’s very first observed year is already at or above τ(k) — the true crossing year is unknown and earlier than what we observe; excluded from lag means, counted separately.
- never-crosses: the country’s observed per-capita values never reach τ(k) within the window the data happens to cover — excluded from lag means, counted separately.
3.2 Lag definition
For each technology, the United States is used as the fixed benchmark (“leader”), consistent with the convention in Comin, Hobijn, and Rovito (2008) of benchmarking lags against the US. Where the US itself has an “ok” crossing year, that year is the benchmark; for all five technologies studied here the US does have a usable crossing year (1877 for telegraph, 1902 for telephone, 1938 for radio, 1990 for cellphone, 1992 for internet), so the fallback rule (using the earliest-crossing country instead) was never triggered.
For country i with an “ok” crossing in year y(i) and benchmark (United States) crossing year y(US):
lag(i, k) = y(i) − y(US)
A negative lag means country i crossed the threshold before the United States did; this is reported as-is, not clipped to zero, because it is informative (several countries, especially in telegraph and telephone, adopted earlier than the US).
3.3 Inference
Mean lags are reported for all countries pooled, for the 29 OECD-2020 countries, and for the 29 non-OECD countries, for each technology. 95% confidence intervals use a cluster (country-level) bootstrap of the mean: countries are resampled with replacement (the natural independent unit here, since each country contributes one lag value per technology), 2,000 replications, fixed seed 42, implemented in code/analysis.py and fully reproducible by re-running that script against results/lag_table.csv.
4. Results
4.1 Mean lag by technology
| Technology | Vintage (US crossing year) | n (ok) | Mean lag, all (yrs) | 95% CI |
|---|---|---|---|---|
| Telegraph (telegrams sent) | 1877 | 33 | 29.5 | 19.2–40.1 |
| Telephone (mainlines) | 1902 | 46 | 47.7 | 40.0–55.1 |
| Radio (sets) | 1938 | 49 | 30.1 | 25.5–35.0 |
| Cellphone (users) | 1990 | 51 | 4.8 | 3.7–5.9 |
| Internet (users) | 1992 | 50 | 4.7 | 3.9–5.5 |
(Full per-country values in results/lag_table.csv; machine-readable summary in results/analysis.json.)
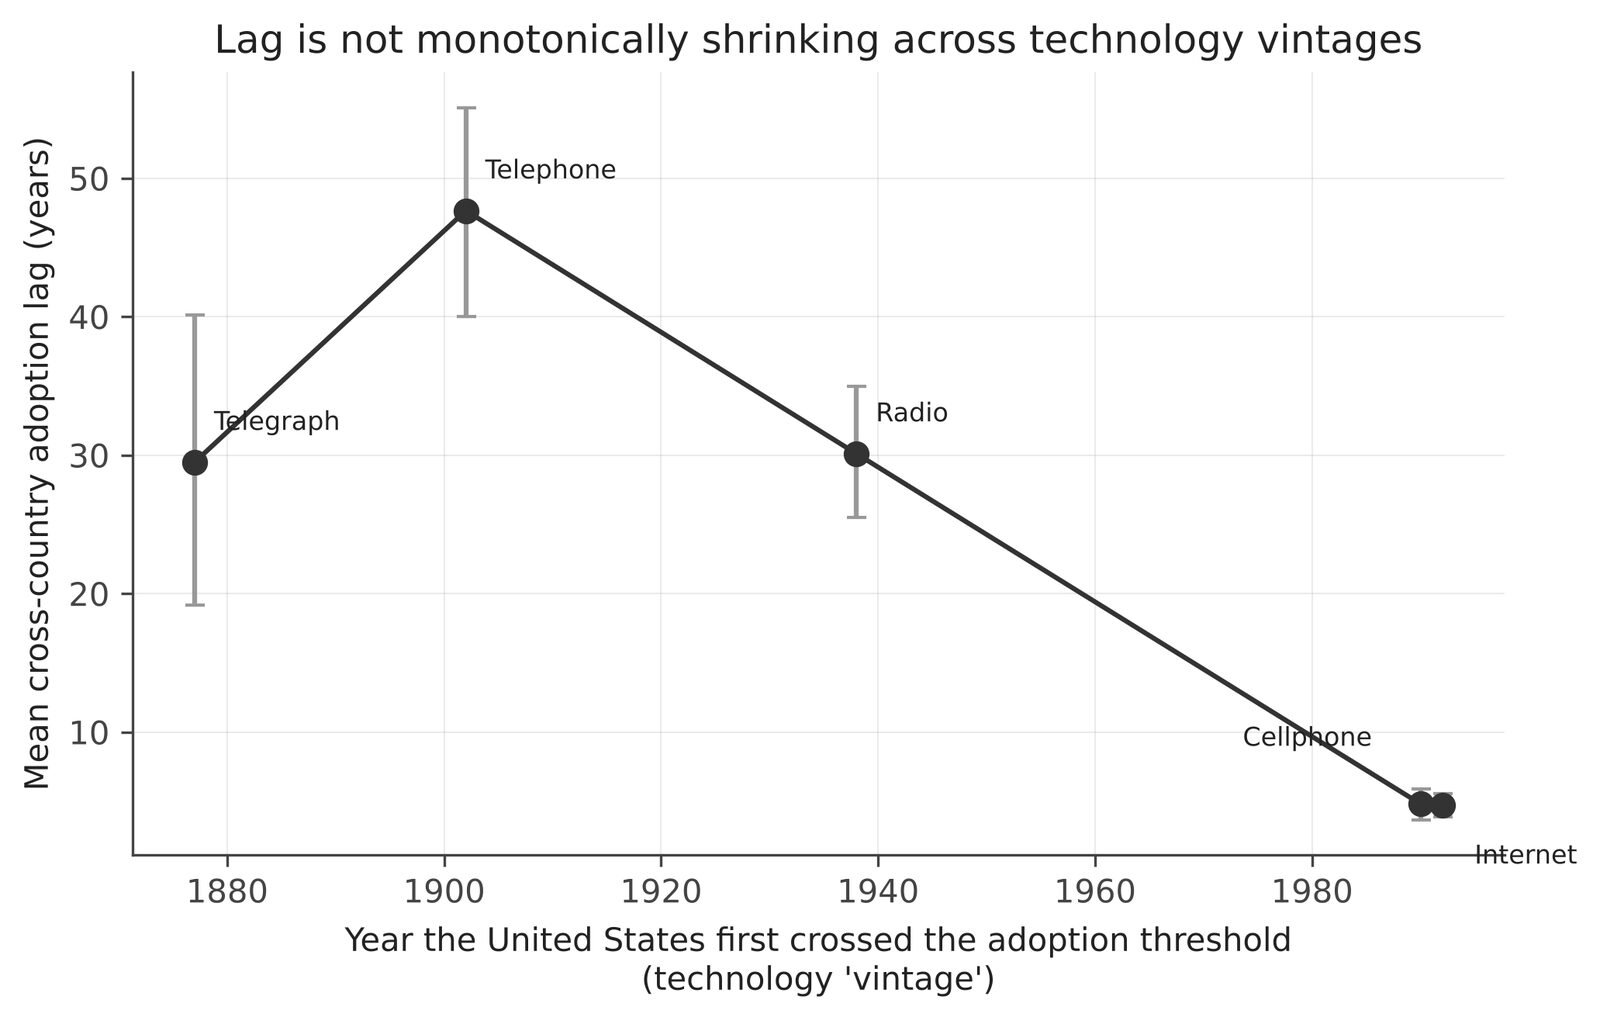
The two most recent technologies — cellphone and internet — show a dramatically shorter mean lag (under 5 years) than the three earlier ones (30–48 years). This much is consistent with the “the world is getting faster at adopting technology” story. But the three earlier technologies do not show a monotonic decline: the telephone’s mean lag (47.7 years) is larger than both the telegraph’s (29.5 years, an earlier technology) and the radio’s (30.1 years, a later one) — see Figure 2. I report this plainly rather than describing only the parts of the pattern that fit a clean monotonic story.
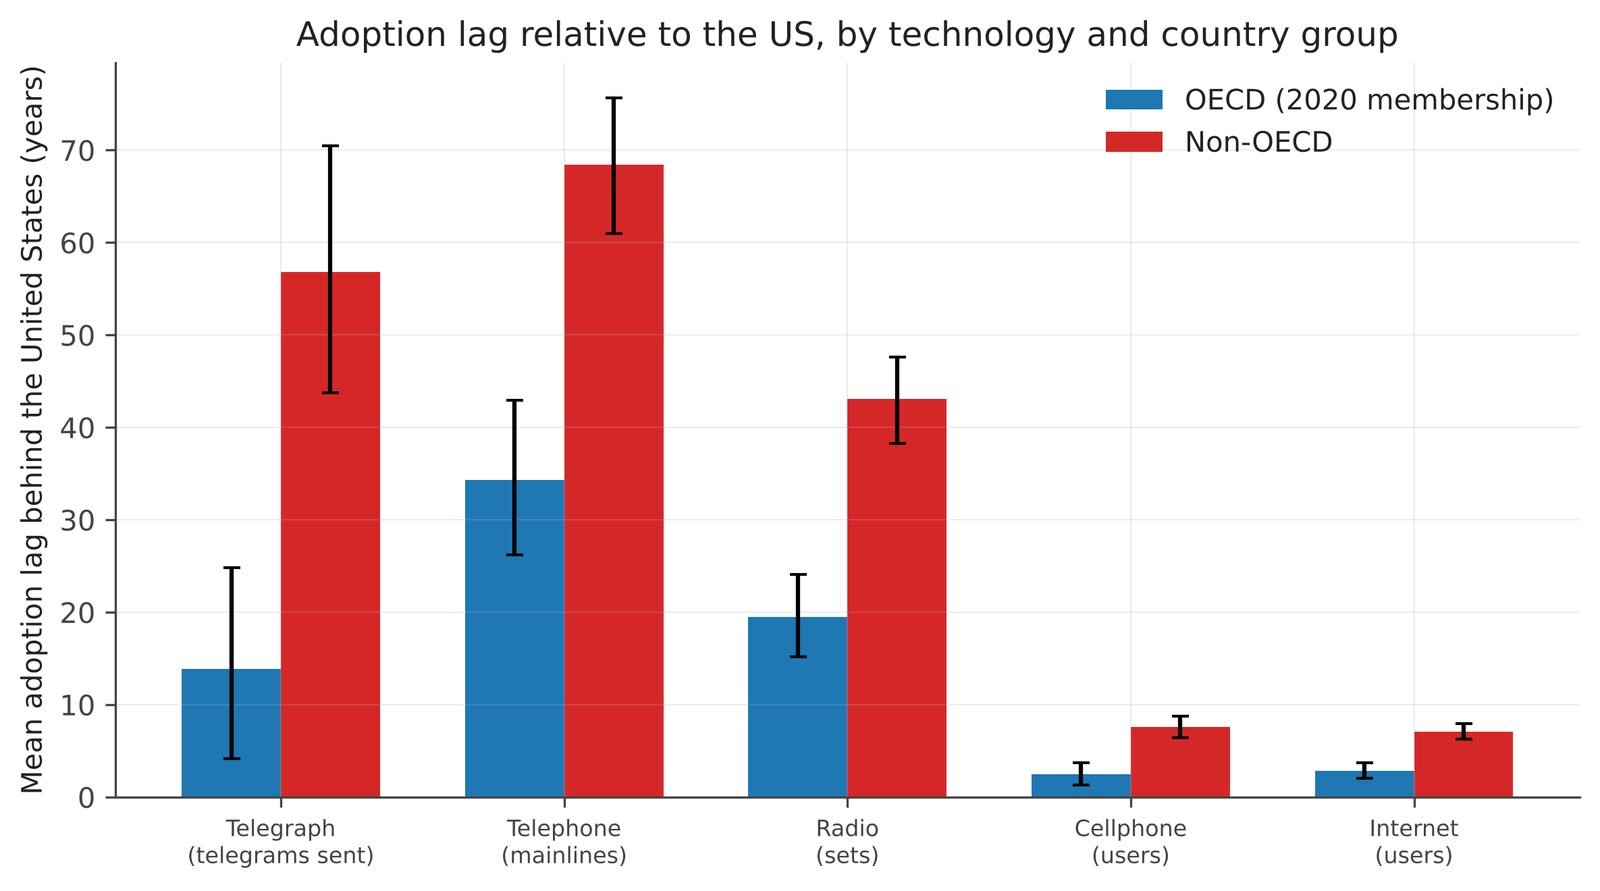
4.2 OECD vs. non-OECD gap
| Technology | OECD mean lag (n=29 max) | Non-OECD mean lag (n=29 max) | Absolute gap (yrs) | Ratio (non-OECD / OECD) |
|---|---|---|---|---|
| Telegraph | 15.0 (n=22) | 58.5 (n=11) | 43.6 | 3.91 |
| Telephone | 35.4 (n=29) | 68.6 (n=17) | 33.2 | 1.94 |
| Radio | 20.7 (n=28) | 42.6 (n=21) | 21.9 | 2.06 |
| Cellphone | 2.7 (n=29) | 7.6 (n=22) | 5.0 | 2.88 |
| Internet | 3.0 (n=29) | 7.1 (n=21) | 4.1 | 2.39 |
(n values are smaller than the full 29/29-country groups because of left-censored and never-crossing countries for each technology — see results/lag_table.csv status counts.)
For every technology studied, OECD countries show a shorter mean lag behind the US than non-OECD countries, and the confidence intervals for the two groups do not overlap for any of the five technologies, including telegraph, despite its smaller, more left-censored sample. The absolute gap narrows steadily with technology vintage (from about 44 years for telegraph down to about 4–5 years for cellphone/internet), but the relative gap (ratio of non-OECD to OECD mean lag) does not shrink monotonically — it is actually smaller for telephone and radio than for telegraph, cellphone, or internet.
4.3 Example diffusion curves
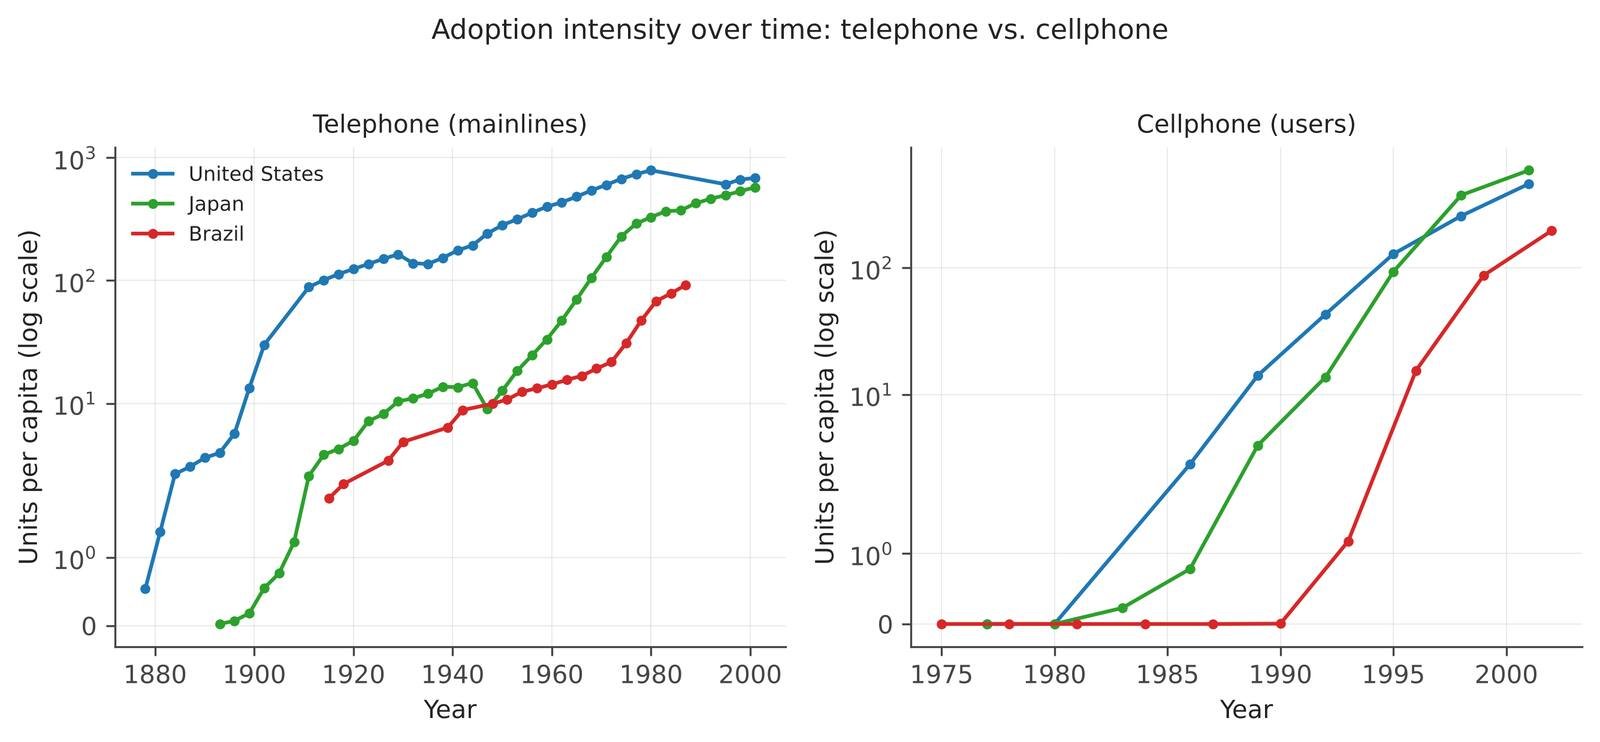
Figure 3 shows per-capita adoption curves for the United States, Japan, and Brazil for telephone and cellphone. The qualitative S-curve shape is visible in all three countries for both technologies; the cellphone panel shows Japan and the US adopting almost in lockstep from the early 1990s, with Brazil’s curve beginning roughly five years later but then climbing at a comparably steep rate once it starts — a pattern broadly consistent with this paper’s headline finding that recent-ICT lags are short and the gap between groups is smaller in absolute terms than for 19th/early-20th-century technologies.
5. Discussion
Three things stand out from this focused re-analysis. First, the two most recent technologies in this panel show adoption lags an order of magnitude smaller than the three older ones, which is consistent with the broad thrust of Comin and Hobijn’s published work on shrinking diffusion lags (Comin & Hobijn, 2010). Second, within the three pre-1950 technologies, the pattern is not a clean monotonic decline — telephone’s lag is the largest of the three, not the smallest, despite being the middle technology by vintage. This could reflect telephone infrastructure’s unusually high fixed capital cost relative to telegraph offices or radio receivers in this period, or it could reflect idiosyncrasies of this specific threshold-crossing definition and country panel; the data as analyzed here cannot distinguish between these explanations, and I do not claim to have identified the mechanism. Third, the OECD/non-OECD gap, while present and significant in every technology studied, shrinks in absolute terms with technology vintage but not in relative terms — a distinction that matters for how one reads “catch-up”: non-OECD countries are closing the gap measured in years, but not obviously closing it as a multiple of OECD’s own lag.
None of this overturns or meaningfully extends Comin and Hobijn’s own published conclusions, which rest on a much larger set of technologies and more elaborate econometric specifications than the single-threshold, five-technology comparison here. This paper’s contribution is narrower: a fully transparent, re-runnable worked example, with every number traceable through results/lag_table.csv and code/analysis.py, that happens to surface a genuine non-monotonicity that a reader taking the “lags are shrinking” story at face value might not expect.
6. Limitations
- Threshold-crossing design, not a full diffusion-curve model. This paper uses a single data-driven threshold per technology and a simple first-crossing-year definition, not a fitted logistic/S-curve model of the kind used in some of Comin and Hobijn’s own work. A different threshold (e.g., a different percentile) would shift the levels of the lag estimates; I have not conducted a full sensitivity analysis across alternative thresholds, which would strengthen this result.
- Coverage, not cherry-picking, drove the choice of these five technologies. They were selected because they are among CHAT’s best-covered variables (6,000–12,500+ non-missing country-years, 77–161 countries), not because of the pattern they produce — the non-monotonic telephone result in particular was not anticipated and is reported as found. Readers should not read the choice of these five technologies, out of CHAT’s 100+, as implying the other 95+ would show a similar or different pattern; they were not examined here.
telegramis a flow variable, not a stock. Annual telegrams sent can decline as a substitute technology takes over, unlike the other four variables (lines, sets, or users accumulated/in use), so its “threshold-crossing” has a somewhat different interpretation and should be read with more caution than the other four.- OECD-2020 membership is an imperfect, retrospective proxy for “high-income/early-industrialized.” It mixes a geopolitical history (e.g., Mexico and Turkey have been OECD members since the 1990s/1960s for reasons beyond income parity) with an economic one, and excludes some currently high-income, early-industrialized economies that are not OECD members (e.g., Singapore). A sensitivity check using a different, contemporaneous income classification would be a natural extension.
- Left-censoring and never-crossing are real limitations of CHAT’s temporal coverage, not artifacts of this paper’s method. For telegraph in particular, 9 of 58 countries are left-censored and 16 never cross within the observed window, leaving only 33 usable lag values; the telegraph estimate is correspondingly the least precise (widest CI) of the five.
- The raw CHAT file was not available locally during the build of this paper, for the network-access reasons described in Section 2.5 and
results/provenance.md. The lag table that every subsequent result in this paper is computed from (results/lag_table.csv) was transferred out of a browser session as printed text, not re-derived from a locally stored copy of the raw CSV. I verified the transcription by confirming thatcode/analysis.py‘s independently recomputed means match, to the available precision, the means the in-browser pipeline itself printed; the bootstrap confidence intervals use a separate, Python-seeded PRNG local to this package and will not be bit-identical to the browser-side bootstrap, though they are close. An auditor who wants to independently re-derive the lag table from the raw CHAT file, rather than check this package’s internal consistency, needs to either re-run the browser-side pipeline (code/browser_pipeline.js) or obtain the raw file through a different channel. This is spelled out further inaudits/note_to_auditors.md.
Related on x9m8
- Does Technology Evolve Like Life? What Cultural Phylogenetics Shows
- Are Ideas Getting Harder to Find? The Science Slowdown Debate
- Branching and Extinction in Patent Citation Lineages: Biotechnology versus Information Storage, 1963-1999
- Open Questions: a series on what science and law have not settled
Research transparency and reproducibility statement
All data are public and require no login (data.nber.org/data-appendix/w15319/FinalCHAT_72909.csv; see results/provenance.md for exact retrieval timestamps and the SHA-256 hash of the file used). All code is included in code/: the disclosed browser pipeline browser_pipeline.js, and the local Python scripts build_lag_table.py, analysis.py, figures.py, style.py, patch_docx.py (which reproduce the lag table, figures, and manuscript formatting from the committed results/lag_table.csv). A full-precision machine-readable summary is in results/analysis.json. No preregistration exists; this is a secondary analysis of existing public data and a preregistration would not meaningfully apply.
Acknowledgements
The author thanks Comin and Hobijn for making the CHAT dataset publicly available. Claude (Anthropic), running as an agentic coding/research assistant (Claude Sonnet 5, 2026-11), assisted with locating and verifying the CHAT dataset’s current hosting location, writing and executing the in-browser JavaScript data pipeline, writing the local Python analysis and figure-generation code, drafting this manuscript text, and typesetting the Word/PDF output. All output was reviewed by the author, who takes full responsibility for the content of this paper.
Author contributions
Peter Kalafatis conceived the study, directed the analysis, reviewed all code and figures, and is the sole author.
Financial support
This research received no specific grant from any funding agency, commercial, or not-for-profit sector.
Conflicts of interest
None.
References
Comin, D., & Hobijn, B. (2004). Cross-country technological adoption: Making the theories face the facts. Journal of Monetary Economics, 51(1), 39–83. https://doi.org/10.1016/j.jmoneco.2003.07.003
Comin, D., & Hobijn, B. (2009). The CHAT dataset (NBER Working Paper No. 15319). National Bureau of Economic Research. https://doi.org/10.60592/csem-gt84
Comin, D., & Hobijn, B. (2010). An exploration of technology diffusion. American Economic Review, 100(5), 2031–2059. https://doi.org/10.1257/aer.100.5.2031
Comin, D., Hobijn, B., & Rovito, E. (2008). Technology usage lags. Journal of Economic Growth, 13(4), 237–256. https://doi.org/10.1007/s10887-008-9035-5