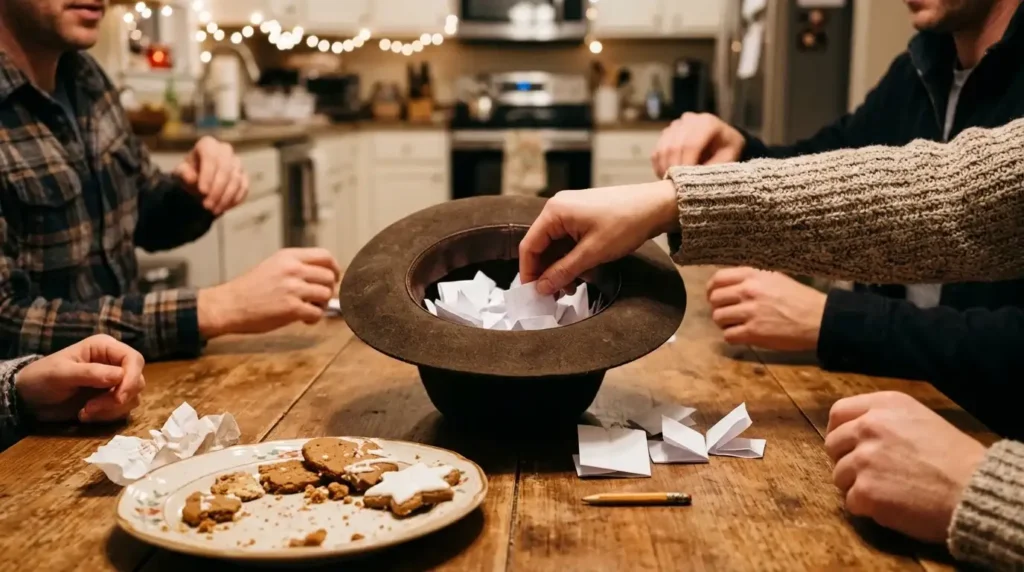
Six people, three couples, one hat, and a house rule that nobody may draw their own name or their partner’s. Under that rule, a family shaking names out of a hat will need nine draws on average before one comes out clean. The famous Secret Santa number, the 36.8% chance that nobody pulls their own name, says it should take fewer than three. That number was only ever describing a room full of strangers.
Thirty-seven percent, and where it comes from
A small word for a big pile of shuffles: derangement
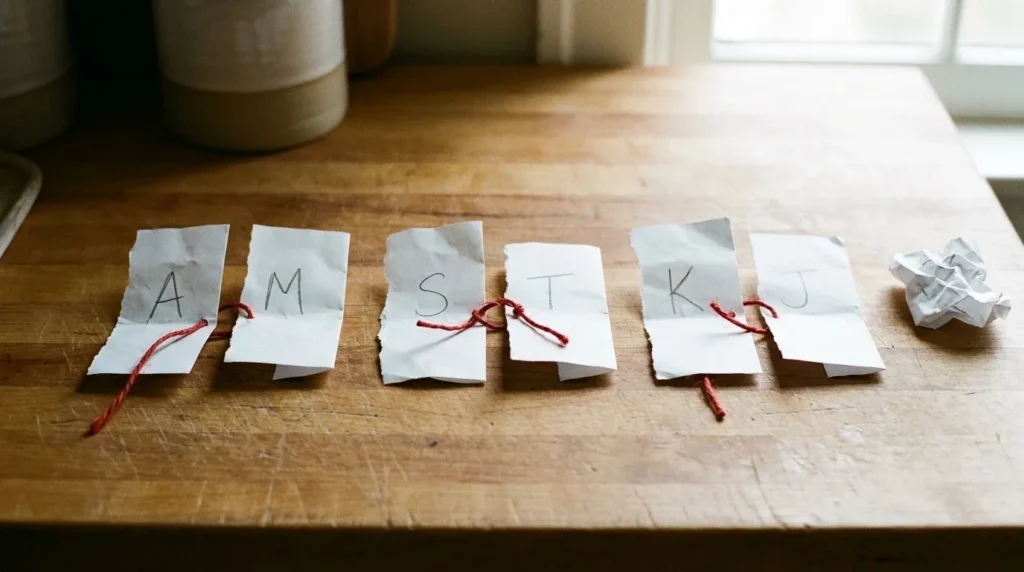
A Secret Santa draw is a shuffle of names. Mathematicians call a shuffle in which nothing lands back in its own spot a derangement, and the question every office party asks is how many shuffles are derangements.
With four people the count is small enough to do on a napkin. There are 24 ways to hand out four names, and Stephen Woodcock, an associate professor of mathematical sciences at the University of Technology Sydney, notes that there are 9 derangements, equal to 24/e rounded to the nearest whole number. So 9 out of 24 draws are good, about 37.5%.
That ratio barely moves as the group grows. Rick Wicklin, writing on SAS’s statistics blog, showed that the share of derangements converges to 1/e ≈ 0.3678, which is where the 36.8% comes from, and he found it striking that the probability “does not depend on the size of the group.” Six people or sixty, the hat fails a little under two times in three. Woodcock frames the same fact from the losing side: approximately 63.2% of possible permutations are not derangements and would have to be thrown out.
Counting derangements is an inclusion–exclusion sum: start with every shuffle, subtract the ones where person 1 is home, subtract person 2, add back the double-counted overlaps, and so on. The alternating sum that falls out, 1 − 1 + 1/2! − 1/3! + …, is the series for 1/e, stopped at the 1/n! term. By six people the missing tail is already invisible at one decimal place.
One self-draw per party, every party
The average doesn’t care how big the office is
There is a second number hiding in the hat, and it is even more stubborn. In the comments under Wicklin’s post, Rob Pratt wrote that “The expected number of people who pull their own names turns out to be exactly 1, independent of the number of people.”
The reasoning fits on a beer mat. Each of N people has a 1-in-N chance of grabbing their own slip, and adding up N copies of 1/N gives exactly one. Woodcock makes the same point for any office size: the expected number of people to be allocated to buy their own gift is the same – just one person.
Everything after this leans on that average. When a rare event happens about once per trial on average, the chance it happens zero times sits close to e raised to minus that average. One expected self-draw gives e⁻¹, the 36.8%. Raise the expected number of bad picks and the zero-chance falls off exponentially: two expected bad picks point toward e⁻², three toward e⁻³.
Couples double the ways to fail
Every partner is a second forbidden slip in the hat
Families rarely play by the strangers’ rules. Spouses already buy for each other, so most households add a clause: no drawing your partner. A University of Melbourne account in The Conversation describes exactly that moment: when one sister drew her own husband, the family “decided to draw again.”
The clause rewrites the arithmetic. A single person still has one forbidden name in the hat. A person in a couple now has two, their own and their partner’s. So the expected number of bad picks in a random draw climbs from 1 to (n + 2k)/n, where n is the family size and k the number of couples. A family where everyone is paired off averages two bad picks per draw, and e⁻² is about 13.5%.
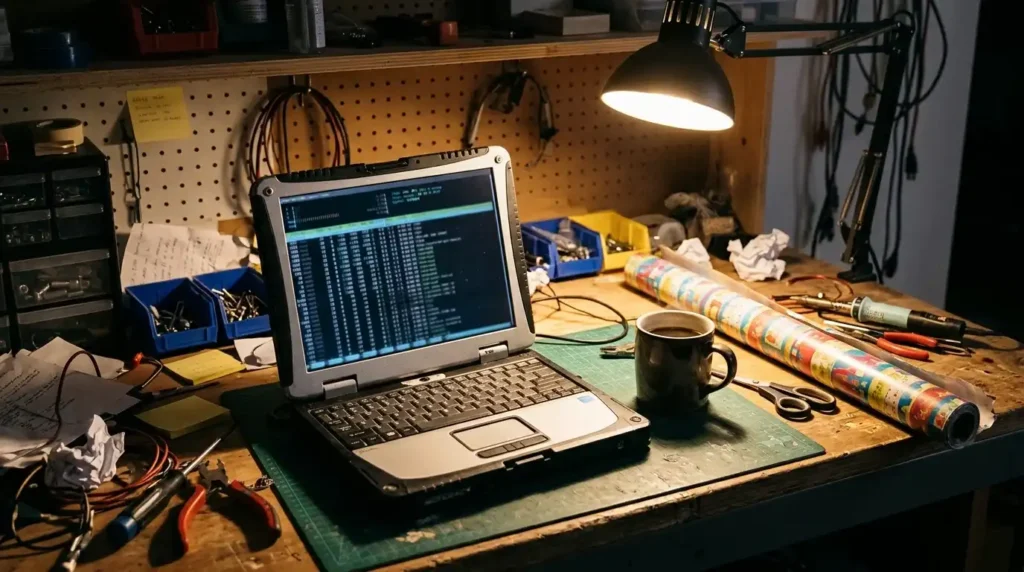
A back-of-envelope exponent is only a sketch, so x9m8 wrote a short Python script, secret_santa.py, to get exact answers. It counts valid draws by inclusion–exclusion over the forbidden cells, treating each couple as a 2×2 block of banned pairings, then checks the formula against brute force (every one of the 3.6 million shuffles for ten people) and against a million random shuffles for twelve. Every brute-force count matched the formula exactly. The Monte Carlo runs landed within a tenth of a percentage point.
The script also reproduces the classic counts as a sanity check: 265 derangements for six people, 14,833 for eight, 1,334,961 for ten.
The numbers, family by family
Nine draws for six people is not a typo
Every figure in the table comes straight from the script. “Average draws” is 1/p, because a family that redraws from scratch each time is running a coin flip with a loaded coin, and the expected wait for a success with probability p is 1/p.
| Family size | Couples | Chance a draw is valid | Gap from 36.8% | Average draws needed |
|---|---|---|---|---|
| 6 | 0 | 36.81% | +0.02 pt | 2.72 |
| 6 | 1 | 23.33% | −13.45 pt | 4.29 |
| 6 | 2 | 16.11% | −20.68 pt | 6.21 |
| 6 | 3 | 11.11% | −25.68 pt | 9.00 |
| 8 | 2 | 20.17% | −16.62 pt | 4.96 |
| 8 | 3 | 15.32% | −21.47 pt | 6.53 |
| 8 | 4 | 11.79% | −25.00 pt | 8.48 |
| 10 | 2 | 23.10% | −13.69 pt | 4.33 |
| 10 | 3 | 18.53% | −18.26 pt | 5.40 |
| 10 | 5 | 12.13% | −24.66 pt | 8.24 |
| 12 | 2 | 25.20% | −11.59 pt | 3.97 |
| 12 | 4 | 17.54% | −19.25 pt | 5.70 |
| 12 | 6 | 12.37% | −24.42 pt | 8.09 |
A single couple in a party of six cuts the success rate from about 37% to 23%. Three couples cut it to exactly one in nine: of the 720 ways to hand out six names, only 80 survive the rule.
The pattern runs against intuition in one direction. With the same share of people paired off, bigger families do slightly better, not worse. Six people in three couples manage 11.1%; twelve people in six couples manage 12.4%; the script’s run for 100 people in 50 couples gives 13.4%, edging up toward that 13.5% sketch. Small families have fewer spare names to absorb the banned ones, so the smallest table pays the steepest price.
The family in The Conversation’s story, eight people with three couples and two singles, sits at 15.3%. On average that family needs six and a half draws.
Averages lie about the bad nights
The hat has a long tail, and somebody always ends up in it
An average of nine draws sounds like an annoyance. The spread is worse than the average.
For the six-person, three-couple family, the first draw fails 89% of the time, and the chance of still being at it after ten draws is about 31%. For the strangers’ version of the game, that ten-draw misery happens about 1% of the time. Same hat, same slips of paper, and the couple rule turns a quick ritual into a stubborn boiler that won’t light.
Households make it uglier. If adult children bring their own households, and the rule becomes “nobody draws anyone they live with,” the script gives these results:
- Ten people in households of 3, 3, 2 and 2: 5.58% valid, about 18 draws on average.
- Ten people as a family of four plus three couples: 3.24%, about 31 draws.
- Twelve people in households of 4, 4, 2 and 2: 2.10%, about 48 draws.
- Twelve people split into two households of six: 0.11%, or exactly 1 draw in 924.
The two-household case has a clean explanation. When two households of six may only draw from each other, every name from house A must land in house B and the reverse, which leaves 6! × 6! good shuffles out of 12!. The ratio is 1 in 924. Somebody’s uncle will propose “just one more try” roughly 923 times.
The case for not doing any of this math
Restarting is slow, but it is the honest way to fix a bad draw
The strongest objection to the whole exercise is practical, and it writes itself: hardly anyone redraws nine times. People peek, swap quietly, let the unlucky drawer put the slip back and pick again, or hand the job to software that applies the exclusions before anyone sees a name.
The shortcuts carry a real cost, though. Hannah Fry, the mathematician who covered the problem for Numberphile, names two requirements for a good draw, total anonymity and an equal chance for everyone to be picked by anyone, and says the traditional hat method “fails on both counts”. In BBC Science Focus, Paul Parsons relays her example: in a group of three, the last person to pick is “twice as likely that the first picker is buying you a present than the second picker” when people put slips back. The same article notes that when the last person is left holding their own name, the only option is to start over, which in a ten-person office happens over 7.5% of the time.
A full restart is the clean fix. Throwing out every bad draw and reshuffling all the names means every valid arrangement is equally likely to come up, which is what the script assumes. The price is the 1/p column. Fry’s alternative, laid out in Science Focus, uses numbered cards cut into two rows and shifted one place, producing a draw the article calls “truly anonymous and perfectly random” in one pass. It doesn’t, as described, handle a no-partners rule, which is exactly the clause that drives the redraws.
So the 36.8% is right. It’s right for an office, a classroom, a group chat of people who share no mailing address. Once every adult at the table comes as half of a couple, the number to remember is closer to 12%, and for a family of six it drops to one draw in nine.
The brother’s question, answered backward
The happy ending he wanted is the one the rule forbids
The Conversation’s story starts with a younger brother asking “What are the chances that all the partners draw each other?” The family’s mathematicians worked it out among the 14,833 draws in which nobody drew themselves: one outcome out of 14,833, or about 0.007%.
Under the no-partners rule, that outcome has a probability of exactly zero. It is one of the 8,657 draws among those 14,833 that the couple clause throws back in the hat.
For anyone who wants to play with other family shapes, more x9m8 work on chance and counting includes a test of whether intelligent life is rare under the hard-steps model, a look at why proof search explodes in automated mathematical discovery, and the cellular automata simulator, where a handful of rules produce far more trouble than they look like they should.
Run time is roughly ten seconds, most of it spent on the brute-force check. Which rule does the family at your table use: partners allowed in the hat, or partners out, and how many draws did it take last year?
Sources
- Rick Wicklin, “Secret Santa: What is the probability that someone pulls her own name from a hat?”, The DO Loop, SAS Blogs, Dec. 4, 2013 (including Rob Pratt’s comment): https://blogs.sas.com/content/iml/2013/12/04/probability-of-pulling-your-own-name-from-a-hat.html
- Stephen Woodcock, University of Technology Sydney newsroom, article on the statistics of Secret Santa (republished from The Conversation), December 2023: https://www.uts.edu.au/news/2023/12/baffling-statistics-secret-santa
- The Conversation, Merry Christmaths: the statistics of Secret Santa (University of Melbourne author): https://theconversation.com/merry-christmaths-the-statistics-of-secret-santa-127730
- Numberphile, “The Problems with Secret Santa,” with Dr Hannah Fry: https://numberphile.com/videos/the-problems-with-secret-santa
- Mental Floss, “Watch: The Mathematical Problems Inherent in Secret Santa”: https://mentalfloss.com/article/89205/watch-mathematical-problems-inherent-secret-santa
- Paul Parsons, BBC Science Focus, “Eight maths hacks to master Christmas,” Dec. 23, 2019: https://www.sciencefocus.com/science/eight-maths-hacks-to-master-christmas
- x9m8,
secret_santa.py(original calculation for this post; exact inclusion–exclusion counts, brute-force check to n = 10, Monte Carlo check at n = 12)