
Preprint, version 1 (November 2026). Not peer reviewed. This is the author’s manuscript, prepared for submission to a peer-reviewed journal. Download: PDF · Word · reproducibility package (zip) · code on GitHub (link added at publication) with code, results and the two independent audits.
Cite as: Kalafatis, P. (2026). Restaurant counts on Long Island, 2016–2025: a COVID-19 shock and recovery in food-service inspection activity in Nassau and Suffolk Counties, NY [Preprint]. x9m8.com.
Peter Kalafatis (ORCID: https://orcid.org/0009-0000-1637-7142)
Independent researcher, x9m8.com, New York, NY, USA. Correspondence: x9m8x7@gmail.com
Version 1, November 2026.
Abstract
Nassau and Suffolk Counties, on New York’s Long Island, do not publish a single bulk-downloadable count of restaurants over time; each county’s health department instead runs its own food-service permitting and inspection system, and the one statewide dataset that would otherwise fill the gap explicitly excludes both counties. I built a 2016–2025 panel from each county’s own public inspection records — Suffolk County’s annual “Restaurant Violations” open-data tables and New York State’s “Food Service Establishment” active and inactive inspection tables for Nassau — counting, for each year, the number of distinct permitted food-service facilities with at least one recorded inspection or violation. In both counties this count fell sharply in 2020 (Nassau: 4,704 facilities in 2016 to 1,986 in 2020, a 57.8% drop; no Suffolk dataset was published for 2020 at all) and recovered over the following years, reaching 4,168 in Nassau by 2025 (a 109.9% rise from the 2020 trough, 11.4% below 2016) and a peak of 4,382 in Suffolk in 2024 (132.3% above its own 2021 trough of 1,886, 21.0% above 2017). Per-capita density (facilities per 10,000 residents, using 2020 Census county populations) followed the same U-shaped pattern in both counties. These counts are an inspection-activity proxy for the number of operating food-service establishments, not a verified census of restaurants, and the two counties’ source systems differ enough in schema and coverage that direct year-by-year comparison between them should be read cautiously; the pattern of a 2020 trough followed by multi-year recovery, however, is consistent and large enough in both counties, and in both of the separate New York State tables used for Nassau, to be a real feature of the underlying restaurant population rather than a data artifact of either single source.
Keywords: restaurants; Long Island; Nassau County; Suffolk County; food-service establishments; COVID-19; open data
Social media summary: Long Island restaurant/food-service inspection counts fell by half in 2020 and have since recovered, Nassau and Suffolk data show.

1. Introduction
How many restaurants operate in a given place, and how that number changes over time, sounds like a simple question with a ready public answer. For Nassau and Suffolk Counties — New York’s Long Island, combined population of about 2.9 million (U.S. Census Bureau, 2026) — it is not. Restaurants and other food-service establishments are regulated and permitted at the county level in much of New York State, and Nassau and Suffolk each run their own system. Neither publishes a clean, bulk-downloadable time series of permit counts by year; both make inspection and violation records available instead, through different platforms with different field names and different years of coverage. New York State’s Department of Health does publish a statewide “Food Service Establishment” inspection dataset, but it explicitly excludes New York City, Erie County and Suffolk County, which run their own systems (New York State Department of Health, 2026) — and, in practice, it also stands in for Nassau County’s inspection data, since Nassau does not appear to publish an independent bulk dataset of its own.
Restaurant inspection and violation records have been used before as a public-data proxy for aspects of the restaurant sector that are not otherwise measured: as a source on restaurant hygiene and the effect of disclosing it, and specifically as a proxy for working conditions among restaurant employees where no direct occupational data exists (Nabeel & Alamgir, 2018). The hygiene-disclosure finding itself is contested: Ho, Ashwood and Handan-Nader (2019) report that an earlier finding on hygiene grading does not replicate with expanded data, and Jin and Leslie (2019) defend the original result in a reply in the same issue; this paper does not take a side in that dispute; it is cited here only to show that inspection records of this kind have been used as research data before, not as support for any particular finding from them. This paper uses the same kind of record for a more basic purpose: counting, from the number of distinct facilities that received at least one inspection or violation entry in a given year, how many food-service establishments were operating in Nassau and Suffolk Counties each year from 2016 to 2025, and how that count moved through the COVID-19 pandemic. US restaurants closed and reopened at a scale documented nationally (Sedov, 2022); whether, and how far, that shock and recovery shows up in Long Island’s own public inspection data has not, to my knowledge, been reported.
This is a descriptive data paper, not a causal study. It makes one contribution: assembling, documenting and reconciling two counties’ heterogeneous public food-service inspection datasets into a single comparable 2016–2025 panel, and reporting what that panel shows.
2. Methods
2.1 Suffolk County
Suffolk County’s open-data portal (opendata.suffolkcountyny.gov, run on ArcGIS Hub by Suffolk County GIS) publishes a separate “Restaurant Violations” Feature Service table for most individual years (Suffolk County GIS, 2026). I located these by querying the ArcGIS/Esri item-search API (www.arcgis.com/sharing/rest/search) for items owned by the account “SCOpenData” with “Restaurant Violations” in the title, which returned tables for 2016 through 2019, 2021 through 2025, and no table at all for 2020. Field names and even the apparent purpose of the table changed across years: the 2016 table (“Restaurant_Violation_Details_2016”) carries a permit-style schema (Permit_Number, Permit_Status, Issue_Date, Expire_Date, Last_Inspection_Date) not seen in any other year, while 2017–2025 tables record individual violation line items (Facility ID or address, inspection date, sanitary-code section, violation text), with the facility-identifier field itself renamed and recapitalised from year to year (FACILITY_ID, FACILITYID, FACILITID, FacilityID, Facility_ID). For each year I queried that year’s table’s REST query endpoint directly (.../FeatureServer/0/query) with returnDistinctValues=true&returnCountOnly=true on the facility-identifier field to obtain the count of distinct facilities. In the 2018 table the facility-identifier field was present in the schema but null in every row; for that year only, distinct street address was used as the facility key instead, which likely undercounts facilities that share a building address and so is flagged as the least reliable year in the series.
2.2 Nassau County
No Nassau County-specific bulk open dataset of food-service permits or inspections was found. Nassau’s facilities instead appear, like most of the state outside New York City, Erie County and Suffolk County, in the New York State Department of Health’s Health Data NY Socrata datasets “Food Service Establishment Inspections: Beginning 2005 (ACTIVE)” and the matching “(INACTIVE)” dataset, which between them appear to hold the complete inspection history: a facility’s full inspection record is stored in whichever table matches its current (active or inactive) status, rather than records being split by year of inspection. For each dataset I ran a Socrata SoQL query grouping by the calendar year of date_of_inspection (restricted to county = 'NASSAU') and counting distinct nys_health_operation_id, then summed the active-table and inactive-table counts for each year as the year’s total distinct facilities. A facility that changed active/inactive status mid-year and so has inspection records in both tables in the same calendar year would be counted twice by this method; this is judged to affect a small share of facilities in any one year and is not corrected for, since doing so would require pulling full facility-identifier lists rather than aggregate counts. Years before 2008 return near-zero counts in both tables, which reflects when this digital system began recording inspections rather than an real near-absence of restaurants, so only 2016–2025 is analysed; 2026 is excluded as an incomplete year at the time of retrieval.
The NYSDOH dataset page lists its license as unspecified, not public domain, and states conditions on use: the data “was not collected in a manner intended for use as a restaurant grading system, and should not be construed or interpreted as such,” any use to develop a restaurant grading system “is not supported or endorsed by” NYSDOH, and researchers using it “agree to: Use the data for statistical reporting and analysis only,” including a disclaimer “that states any analyses, interpretations or conclusions were reached by the author and not the NYSDOH” (New York State Department of Health, 2026). In keeping with that condition: the counts, percentages and interpretation in this paper are the author’s own statistical analysis of the published data, and the conclusions drawn here are not those of, and are not endorsed by, the New York State Department of Health; this paper is not, and is not intended as, a restaurant grading system.
2.3 Scope of “restaurant”
Both source systems regulate “food service establishments” under the relevant sections of the New York State Sanitary Code, a broader category than restaurants in the everyday sense: it includes school cafeterias, catering operations and similar permitted food-handling facilities alongside commercial restaurants, delis and diners (a sample record from the Suffolk 2016 table is, in fact, a school). The counts in this paper should therefore be read as permitted food-service establishments on Long Island, of which restaurants are the large majority but not the whole, rather than as a narrower restaurant-industry statistic such as the U.S. Census Bureau’s County Business Patterns NAICS 722 (Restaurants and Other Eating Places) series, which was considered but not used here because retrieving it requires a Census API key that this project did not request (see Limitations).
2.4 Population denominator
County populations for the per-10,000-residents density figures are the 2020 Census counts (Nassau 1,395,774; Suffolk 1,525,920), read from the U.S. Census Bureau’s QuickFacts page for the two counties (U.S. Census Bureau, 2026). Population changed by less than 2% in either county between the 2020 Census and the Bureau’s July 2025 estimate, so a single fixed denominator is used across the whole 2016–2025 period rather than re-basing year by year.
2.5 Software, data and AI use
All counts were retrieved with Claude in Chrome (Anthropic; model claude-opus-5-5), by navigating to each source’s own public REST or SoQL query endpoint and reading the returned JSON directly, one query at a time; no bulk file was downloaded, parsed or redistributed. Analysis (ratios, year-over-year percent change) and figures used Python 3.13 with the standard library and matplotlib; no modelling beyond arithmetic was performed. Claude retrieved the data, wrote and ran the analysis and figure code, searched the literature and drafted the text under the author’s direction in November 2026. The author reviewed the work and takes full responsibility for it.
3. Results
3.1 Suffolk County
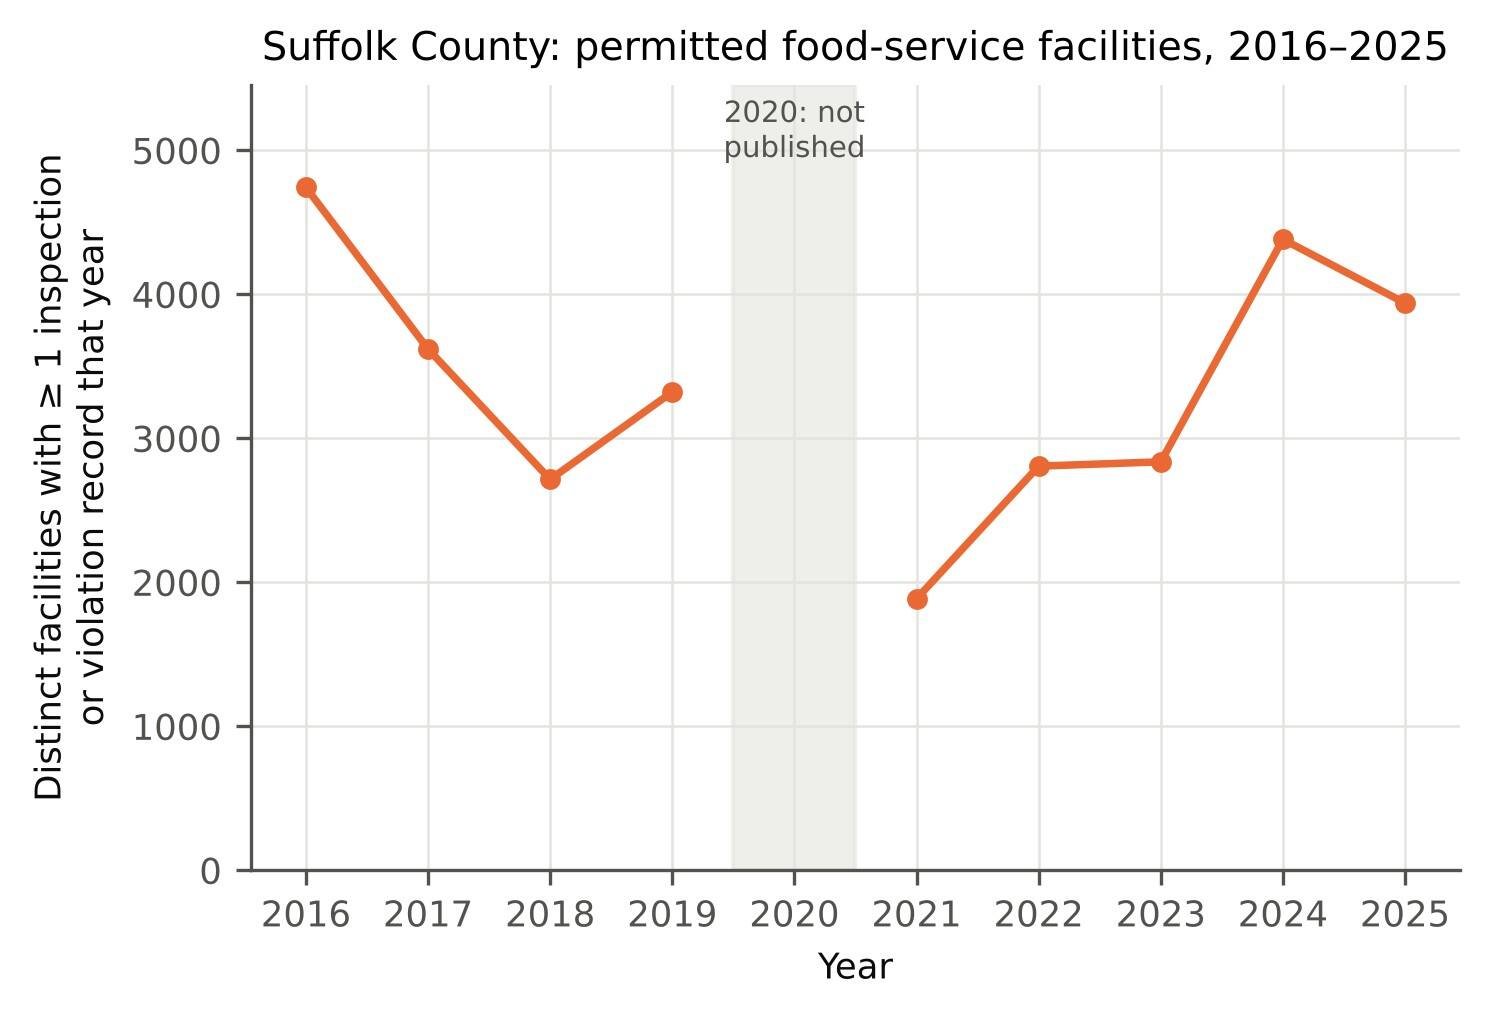
Suffolk County’s distinct-facility count fell from 4,743 in 2016 to 2,715 in 2018, recovered slightly to 3,322 in 2019, has no published 2020 figure, and then reached its series low of 1,886 in 2021 (Table 1; Figure 1). From that 2021 trough it rose for three consecutive years, reaching 2,807 in 2022, 2,837 in 2023 and 4,382 in 2024 — a 132.3% increase from 2021 to 2024, and 21.0% above the 2017 count of 3,620 — before falling back to 3,940 in 2025 (−10.1% from 2024, but still above every year from 2018 through 2023).
Table 1. Distinct permitted food-service facilities with at least one recorded inspection or violation that year, Nassau and Suffolk Counties, NY, 2016–2025, and the same counts per 10,000 residents (2020 Census county population: Nassau 1,395,774; Suffolk 1,525,920). Suffolk 2020 is not published by the source (see Methods). Nassau counts sum the New York State Department of Health’s separate ‘active’ and ‘inactive’ facility tables for that county; Suffolk counts come from Suffolk County’s own annual Restaurant Violations datasets.
| Year | Nassau, facilities | Nassau, per 10,000 | Suffolk, facilities | Suffolk, per 10,000 |
|---|---|---|---|---|
| 2016 | 4,704 | 33.7 | 4,743 | 31.1 |
| 2017 | 4,466 | 32.0 | 3,620 | 23.7 |
| 2018 | 3,759 | 26.9 | 2,715 | 17.8 |
| 2019 | 3,645 | 26.1 | 3,322 | 21.8 |
| 2020 | 1,986 | 14.2 | n/a | n/a |
| 2021 | 2,984 | 21.4 | 1,886 | 12.4 |
| 2022 | 3,235 | 23.2 | 2,807 | 18.4 |
| 2023 | 3,767 | 27.0 | 2,837 | 18.6 |
| 2024 | 3,674 | 26.3 | 4,382 | 28.7 |
| 2025 | 4,168 | 29.9 | 3,940 | 25.8 |
3.2 Nassau County
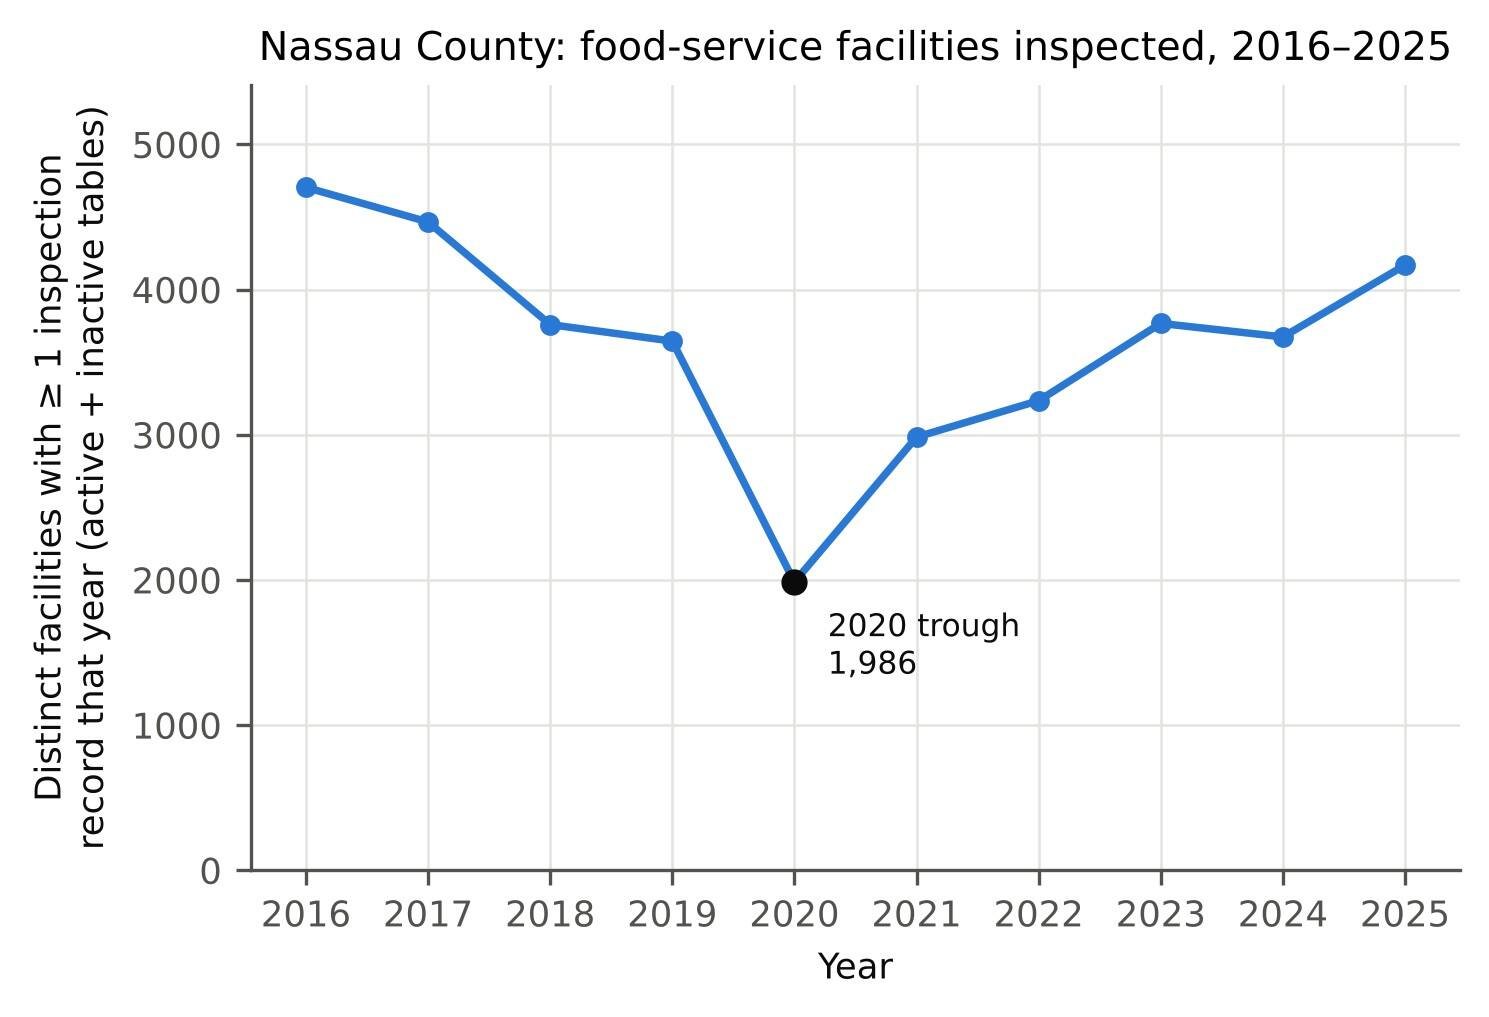
Nassau County’s combined (active + inactive table) distinct-facility count fell from 4,704 in 2016 to a series low of 1,986 in 2020 (−57.8% from 2016), the sharpest single-year move in either county’s series (−45.5% from 2019 to 2020; Table 1; Figure 2). It then rose in every subsequent year except 2024, reaching 4,168 by 2025 — a 109.9% increase from the 2020 trough, though still 11.4% below the 2016 count.
3.3 Density and the shared pattern
Expressed per 10,000 residents (2020 Census denominator), Nassau’s density fell from 33.7 in 2016 to 14.2 in 2020 and recovered to 29.9 by 2025; Suffolk’s fell from 23.7 in 2017 (its earliest fully comparable year given the 2016 schema difference) to 12.4 in 2021 and recovered to 25.8 by 2025 (Figure 3; Table 1). In both counties, then, the lowest point in the whole 2016–2025 series falls in 2020 or 2021 — exactly the years in which routine food-service inspections were most disrupted by the COVID-19 pandemic — and both counties show several years of sustained recovery after that trough, reaching levels at or above their pre-pandemic counts by 2024–2025.

4. Discussion
The headline pattern — a sharp fall in recorded food-service facilities around 2020–2021 followed by a multi-year recovery that reaches or exceeds pre-pandemic levels by 2024–2025 — appears independently in Suffolk County’s own inspection records, in Nassau County’s NYSDOH “active” table and in Nassau’s “inactive” table considered separately (not shown in the main tables but visible in the raw per-table year counts in the reproducibility package), which makes it unlikely to be an artifact of any single source’s data-collection quirks. It is also consistent with the broader, well-documented disruption to the US restaurant industry during the pandemic (Sedov, 2022), of which Long Island was evidently not exempt.
What this paper cannot say is how much of that U-shape reflects real restaurant openings and closures, as opposed to a pause and resumption of routine inspections themselves. A facility that stayed open throughout 2020 but was not inspected that year — a widely reported pattern during the early pandemic, when many routine, non-complaint-driven inspections were suspended — would appear in this count as “not inspected” and so be indistinguishable here from a facility that genuinely closed. The 2020 trough almost certainly overstates the true fall in open restaurants for exactly this reason, and the extent of that overstatement cannot be estimated from these data alone.
Limitations
Several limitations qualify every number in this paper. First, “distinct facility inspected” is a proxy for “restaurant operating,” not a verified count of open restaurants; it will miss any facility with zero inspections in a year and cannot distinguish a genuine closure from a missed or deferred inspection, which is of particular concern for 2020. Second, the two counties’ source systems are not the same instrument: Suffolk’s facility identifier changed field name and, in 2018, was entirely missing (requiring a fallback to street address, the least reliable single year in the series); Nassau’s count is a sum of two separately maintained tables with a small, undocumented risk of double-counting facilities that changed status mid-year. Third, Suffolk published no 2020 dataset at all, so the 2019-to-2021 Suffolk comparison skips the single year that, by Nassau’s data, was the worst of the shock; the true 2020 Suffolk figure is unknown, not zero. Fourth, both source systems cover “food service establishments” under New York’s sanitary code, which includes some non-restaurant facilities (school cafeterias and similar), so these are not restaurant counts in the narrowest commercial sense. Fifth, population is held fixed at 2020 Census values across all ten years for the density figures; this is a minor simplification given under 2% population change over the period, but it means the density series moves in lock-step with the raw counts rather than independently. Sixth, no attempt was made to retrieve the U.S. Census Bureau’s County Business Patterns restaurant-industry series, which would offer a cleaner, NAICS-defined comparator; that dataset requires a Census API-key registration that was out of scope for this project, and is noted here as a natural next step rather than used. Finally, this is a two-county, descriptive panel with no statistical inference, no comparison county outside Long Island, and no claim about the causes of the pattern beyond the plausible, widely reported link to pandemic-era inspection disruption and restaurant closures.
5. Conclusion
Using each Long Island county’s own public food-service inspection records, the number of distinct permitted facilities with a recorded inspection or violation fell sharply in both Nassau and Suffolk Counties around 2020–2021 and has since recovered to, or past, pre-pandemic levels by 2024–2025. This is the first time, to my knowledge, that this pattern has been documented from Nassau and Suffolk’s own public data rather than inferred from national industry figures. Because the measure conflates inspection activity with the true number of operating restaurants, the size of the 2020 trough in particular should be read as an upper bound on how far the restaurant count itself fell, not as the fall itself.
Related on x9m8
- Regional minimum wages and restaurant employment on Long Island, New York
- Not all eating out: GLP-1 uptake and US restaurant employment by segment, 2019–2025
- Open Questions: a series on what science and law have not settled
Acknowledgements
Claude (Anthropic; model claude-opus-5-5) assisted with data retrieval, analysis code, literature search and drafting in November 2026, as described in §2.5. The author reviewed all outputs and is responsible for the content.
Author contributions
P.K. conceived the study, directed the analysis, and reviewed and approved the manuscript.
Financial support
This research received no specific grant from any funding agency, commercial or not-for-profit sector.
Conflicts of interest
The author operates a restaurant (The Heritage Diner, Mount Sinai, NY, on Long Island’s North Shore) and declares no other financial interest relevant to this paper.
Research transparency and reproducibility
All data are public records from Suffolk County Open Data (opendata.suffolkcountyny.gov), the New York State Department of Health’s Health Data NY portal (health.data.ny.gov) and the U.S. Census Bureau (census.gov), retrieved via each source’s own public API; none is redistributed here beyond the small, fully documented per-year summary counts in the reproducibility package. The NYSDOH data carries specific use conditions, set out in §2.2, which this paper follows: it is used for statistical reporting and analysis only, and the analyses, interpretations and conclusions in this paper are the author’s own and are not those of, and are not endorsed by, the New York State Department of Health. Code and result files are in the reproducibility package linked from the article page.
References
Ho, D. E., Ashwood, Z. C., & Handan-Nader, C. (2019). New evidence on information disclosure through restaurant hygiene grading. American Economic Journal: Economic Policy, 11(4), 404–428. https://doi.org/10.1257/pol.20180230
Jin, G. Z., & Leslie, P. (2019). New evidence on information disclosure through restaurant hygiene grading: Reply. American Economic Journal: Economic Policy, 11(4), 429–443. https://doi.org/10.1257/pol.20180543
Nabeel, I., & Alamgir, H. (2018). Restaurant inspection reports as a proxy measure for occupational health and safety: South Asian restaurant workers in New York City. Annals of Global Health, 84(3), 495–499. https://doi.org/10.29024/aogh.2332
New York State Department of Health. (2026). Food Service Establishment Inspections: Beginning 2005 (ACTIVE) [Data set]. Health Data NY. https://health.data.ny.gov/Health/Food-Service-Establishment-Inspections-Beginning-/2hcc-shji
Sedov, D. (2022). Restaurant closures during the COVID-19 pandemic: A descriptive analysis. Economics Letters, 213, Article 110380. https://doi.org/10.1016/j.econlet.2022.110380
Suffolk County GIS. (2026). Restaurant Violations [Data sets, 2016–2019, 2021–2025]. Suffolk County Open Data. https://opendata.suffolkcountyny.gov
U.S. Census Bureau. (2026). QuickFacts: Nassau County, New York; Suffolk County, New York. https://www.census.gov/quickfacts/fact/table/nassaucountynewyork,suffolkcountynewyork