





A Korean team used cosmic-ray muons to follow the tide above an undersea tunnel, resolving about a meter of seawater. How it works and its limits.
Two plastic scintillator panels in a road tunnel under the West Sea of Korea have done something unusual. By counting cosmic-ray muons and nothing else, they followed the rise and fall of the tide overhead. A group from Chung-Ang University posted the result to arXiv on October 4, 2026, reporting that the muon rate tracks an independent tide gauge closely enough to resolve changes in seawater depth of about a meter.
This is a preprint, so nobody outside the collaboration has refereed it yet, and it rests on one detector at one site. Even so, it is a tidy demonstration of muography in a setting where the answer can be checked against a conventional instrument. The way the numbers fit together is more interesting than the headline.
What the Chung-Ang team actually did
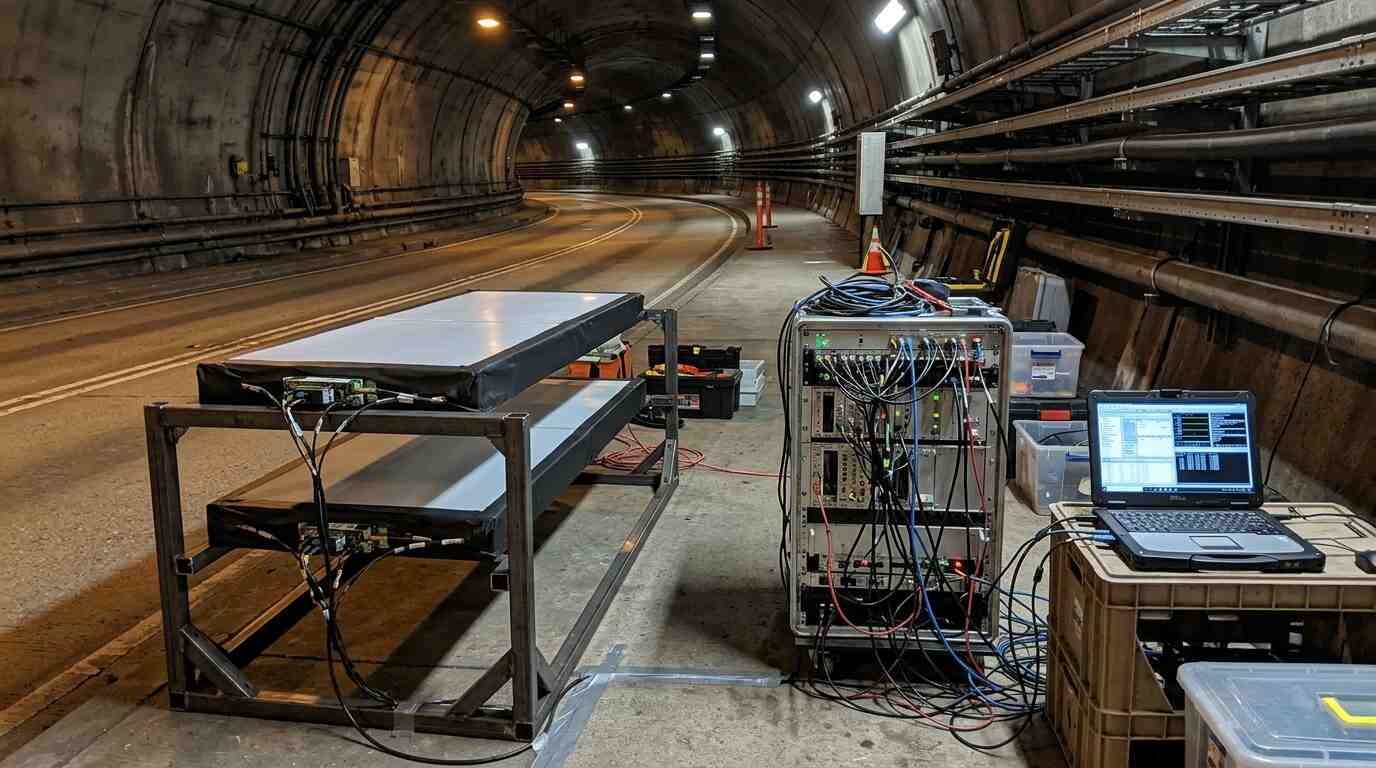
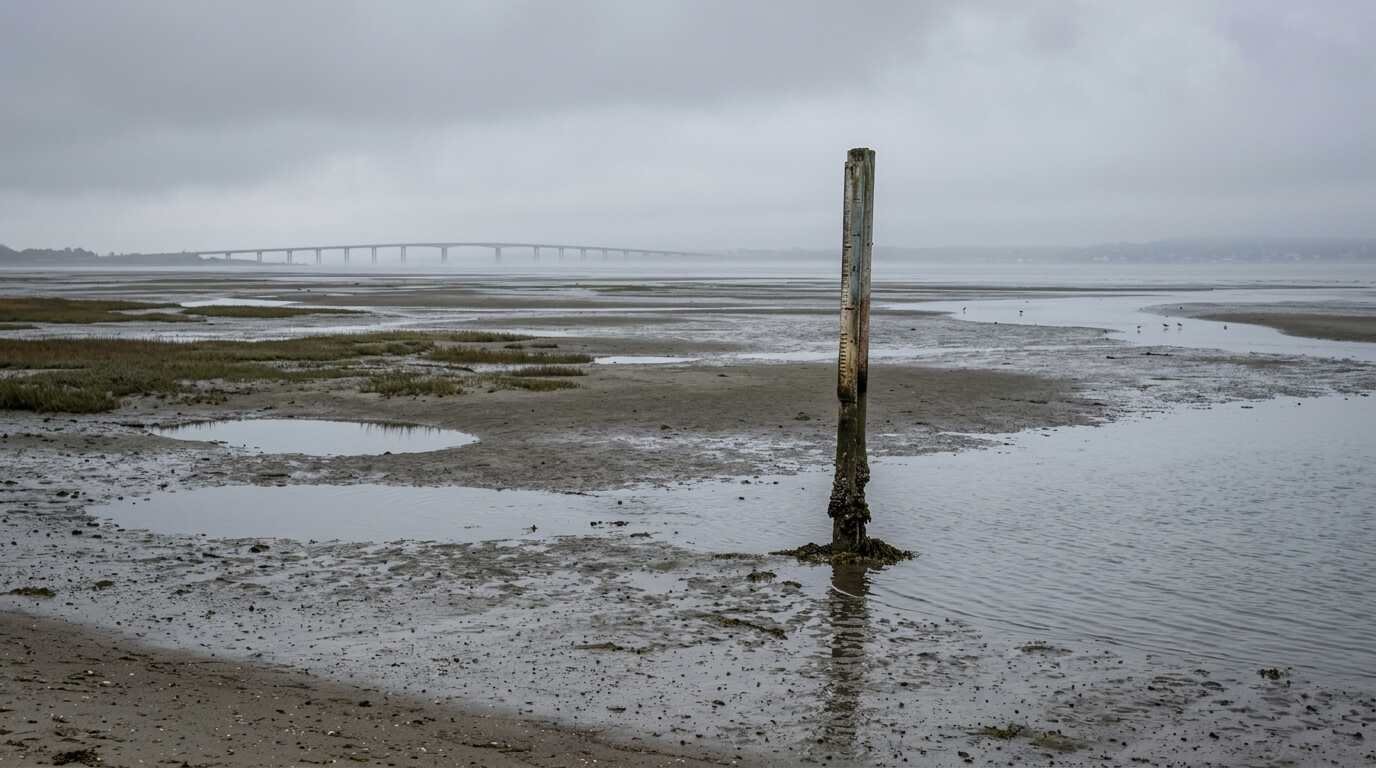
The detector sits at station 5593 of the Boryeong Undersea Tunnel, a 6.9 km road tunnel beneath the West Sea of Korea. At that spot the rock cover is 26.0 m at its minimum and the seawater cover reaches 33.8 m at its maximum, according to the paper. Above the detector, then, there is a layer of water whose thickness changes by several meters twice a day.
The group ran a stationary measurement for 31.6 days, from August 11 to September 12, 2025, and collected about 1.9 million coincident muon events. They compared the hourly muon rate with readings from a Korean tide gauge at Boryeong, roughly 6.6 km from the detector, and fitted a simple linear model: rate equals a baseline minus a coefficient times the sea level. A separate spatial scan with a portable detector, carried along the tunnel in ten one-way traversals, was used to check that the seawater really belongs in the overburden model.
Why a muon notices the sea
Muons are made when primary cosmic rays hit the upper atmosphere, and they reach sea level at a rate of order one per square centimeter per minute. They lose energy mostly by ionizing the matter they pass through, so the more material lies between the sky and the detector, the fewer muons arrive. Particle physicists have used the same logic for decades to image pyramids and volcanoes.
What matters is mass per unit area along the path, not thickness alone. Seawater is less dense than rock, so a meter of water stops fewer muons than a meter of stone, but a tidal swing of ±4 m (the range the authors cite from Korean hydrographic data) still changes the column enough to show up in the counts. The paper makes the point that a tide gauge reports the level at one place, while the muon rate responds to the whole overburden above the detector.
The detector and its trigger
Nothing exotic is involved. Two Eljen EJ-200 plastic scintillator panels, each 1000 × 500 × 20 mm, are stacked 42 cm apart. Each panel is read out by 40 silicon photomultipliers, Hamamatsu S13360-6075PE devices in a 10 × 4 grid. A muon passing through both panels produces coincident light, and the trigger requires at least eight hits among the 80 channels inside a 1000 ns window.
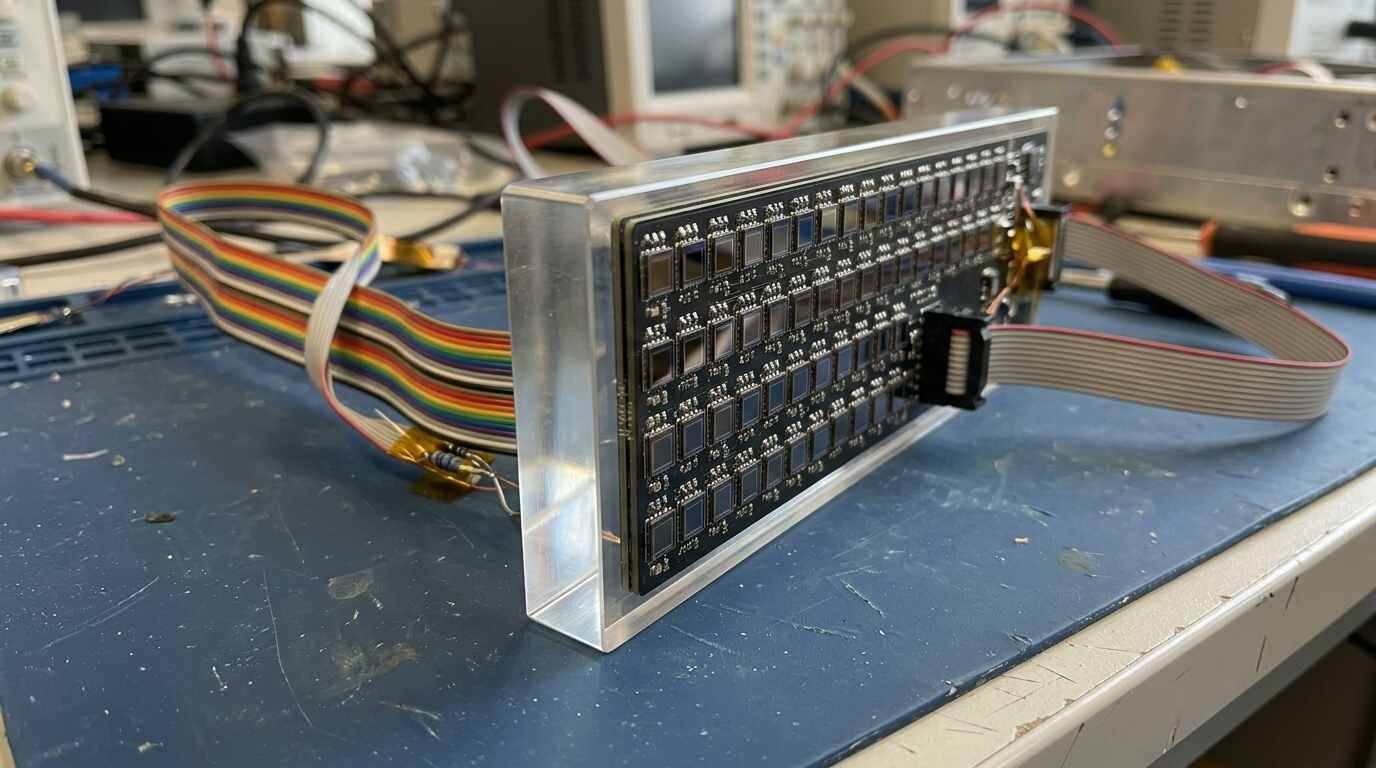
Candidate muons must deposit more than 2.6 MeV in each panel, well above the roughly 1 MeV trigger threshold, which keeps out much of the gamma background. The authors estimate gamma contamination below 0.1% and a muon efficiency of 99%. Silicon photomultiplier gain drifts with temperature, so they corrected it at 28 ± 1 °C using the 2614 keV Compton edge of thallium-208 as a reference line.
Working through the numbers
The fitted mean rate is R0 = 2515 ± 2 counts per hour. The fitted attenuation coefficient is k = 43.2 ± 1.0 counts per hour per meter of water. Divide one by the other and you get 1.72% per meter, which matches the relative response the paper quotes (1.72 ± 0.04% per meter of sea-level rise).
Now scale that to the tide. A ±4 m swing moves the rate by about ±173 counts per hour, or ±6.9% of the mean. The largest excursion in the dataset was a rise of nearly 9% above average, which the paper ties to roughly a 5 m drop in seawater overburden; 5 × 43.2 is 216 counts per hour, or 8.6% of 2515, so the pieces agree.
Counting statistics set the resolution. At 2515 counts per hour, Poisson noise is the square root, about 50 counts, or 2.0% of the rate. That is exactly the residual RMS the authors report (2.0%), which tells you the fit is limited by the number of muons rather than by some unmodeled effect. Dividing 50 counts by 43.2 counts per meter gives about 1.2 m of depth uncertainty per one-hour bin. This is my own back-of-envelope figure, not a number from the paper, but it explains why the authors describe meter-scale sensitivity and not centimeter-scale.
The fit quality supports that picture: chi-squared of 768.1 for 755 degrees of freedom, with a correlation of r = −0.85 between muon rate and seawater level. The sign is right, since more water means fewer muons. The tally also checks out: 31.6 days is 758 hourly bins, and 758 bins at 2515 per hour gives 1.9 million events.
The tidal rhythm in the frequency domain
A Fourier transform of the muon series shows a semidiurnal peak at 12.3 ± 0.2 hours, close to the familiar 12.4-hour lunar tidal period (the paper’s methods section quotes 12.4 h, and the two values differ slightly in the text). A spring-neap component appears at 16 ± 8 days against an expected 14.8 days. That second figure is soft. A 31.6-day record contains barely two spring-neap cycles, so the frequency bin is wide, and the authors’ estimate is coarse for a reason of arithmetic, not of physics.
The authors also tested whether the atmosphere could be faking the tide. Air pressure and the temperature of the upper atmosphere both modulate the muon flux. Using reanalysis data, they set 90% upper limits of 0.6 counts per hour per hPa and 0.6 counts per hour per °C. Compared with the tidal term, which swings the rate by hundreds of counts, these are small, and the fitted value of k did not move when the terms were included.
The spatial scan and the water in the model
A rate in a single spot cannot say whether the water or the rock is doing the shielding, so the authors added a spatial scan. A portable detector traveled along the tunnel in ten one-way traversals, five round trips, on June 30, 2025, and the counts were compared with two overburden models. One used rock alone. The other used rock plus seawater. The second won decisively, by a log-likelihood difference of 230, which in practice means the rock-only model cannot reproduce the data.
The scan also provides a rate check at the stationary spot. The portable detector saw 0.74 ± 0.12 counts per second at the station, while the 31.6-day run gives 0.698 counts per second. These agree within the scan’s error. For scale, the paper puts the expected coincidence rate at the surface near 36 counts per second, so the tunnel location sees roughly one muon in fifty of those arriving at the surface. The deep, mostly rock-and-water column is why the experiment is slow, and it is the reason the run lasted a month.
The seven-minute lead
The fit includes a time offset between the muon signal and the tide gauge, and it comes out at −414 ± 157 s, about 6.9 ± 2.6 minutes, with the muon signal leading. That is only 2.6 standard deviations from zero, so it is a hint rather than a finding. The authors built a plausibility check around it: they fitted six nearby tide gauges and found that their time shifts correlate with latitude (r = −0.96), which suggests the tidal wave moves along the coast.

Dividing the 6.6 km gauge distance by 414 s gives about 16 m/s, which is the apparent phase speed the paper quotes (16 ± 6 m/s) and which it calls consistent with shallow-water tides. The distance is an assumed effective path, though. The detector does not sit next to the gauge, so part of the offset may simply reflect geography. Treat the number as a consistency check, not a measurement of tidal propagation.
What the result does not show
The Monte Carlo simulation predicts a response of 1.89 ± 0.03% per meter, about 10% higher than the measured 1.72%. The only systematic uncertainty included in that simulation is the rock density, varied between 2.60 and 2.70 g/cm³, and the paper does not explicitly discuss the gap. A reader could reasonably suspect the assumed overburden profile, since it comes from design elevations and one effective density.
Other limits are plain. Only integrated rates were used, with no directional reconstruction. The spatial scan was taken on June 30, 2025, weeks before the stationary run. And everything comes from a single tunnel, a single detector and about a month of data. The result shows that muography can follow a known, large, periodic change in overburden. It does not show that the method could replace a tide gauge, which is cheaper and more precise.
One modeling choice is worth naming. As summarized from the paper, the fit takes the tide-gauge level, interpolated to the detector’s one-hour bins, as the water thickness overhead. That ignores how the sea surface might differ over the stretch of tunnel the detector effectively sees. The residuals show no structure, but a counting-limited fit would look flat whether or not the model were exact.
Frequently asked questions
How can muons measure the tide?
Muons lose energy passing through matter, so fewer reach a detector under a thicker column of water or rock. When the tide rises above an undersea tunnel, the muon count drops by a predictable amount, about 1.7% per meter in this experiment.
How accurate is the muon tide measurement?
The paper reports sensitivity to meter-scale changes in seawater depth. The statistical error on an hourly count corresponds to about 1.2 m by this article’s own estimate, so it is far coarser than a tide gauge.
Has the study been peer reviewed?
Not as of this writing. It is an arXiv preprint dated October 4, 2026, and no journal reference was listed on the page when it was retrieved.
Could this technique be useful beyond tides?
The authors conclude that muography can quantitatively track small, time-dependent environmental changes in overburden. Any practical use would need more sites, more months of data and better control of the density model.
The appeal of this experiment is that its answer was known in advance, which is rare in muography. Pyramids and volcanoes have no reference gauge, but the tide does, and the muon signal agreed with it to within counting noise over a full month. The gaps worth watching are the 10% mismatch with the simulation and the seven-minute lead, both of which a longer run or a second tunnel could settle. If they hold up, the more interesting application is not tides at all but slower, quieter changes in the mass above a detector that have no convenient gauge.
Sources