
Preprint, version 1 (November 2026). Not peer reviewed. This is the author’s manuscript, prepared for submission to a peer-reviewed journal. Download: PDF · Word · reproducibility package (zip) · code on GitHub (link added at publication) with code, results and the two independent audits.
Cite as: Kalafatis, P. (2026). What starts fires in restaurants and bars: Twenty-one years of US Fire Administration national estimates for eating and drinking establishments, 2003–2023 [Preprint]. x9m8.com.
Peter Kalafatis (ORCID: 0009-0000-1637-7142)
Independent researcher, x9m8.com, New York, NY, USA. Correspondence: x9m8x7@gmail.com
Version 1, November 2026.
Abstract
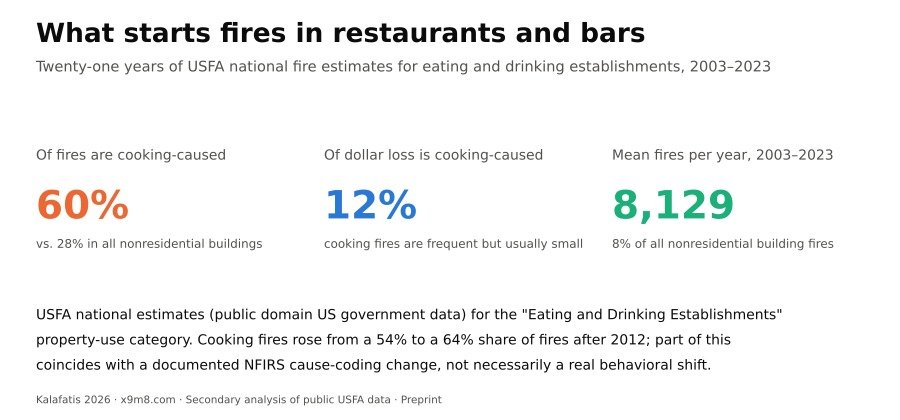
Cooking is the textbook cause of restaurant fires, but how large and how stable that share is, and what it costs, is less often shown with public national data. I used the U.S. Fire Administration’s (USFA) published national fire estimates for the “eating and drinking establishments” nonresidential-building property-use category, 2003–2023, to describe the frequency, cause distribution and dollar loss of fires in US restaurants, bars and similar establishments, and to compare them with all nonresidential building fires over the same period. An estimated 6,600 to 9,800 fires occurred in eating and drinking establishments each year (mean 8,129), about 8.0% of all nonresidential building fires. Cooking was the leading cause throughout, rising from a 54.5% share of fires in 2003–2011 to 64.1% in 2015–2023, far above cooking’s 28.0% share of all nonresidential building fires. Part of that rise coincides with a documented 2012–2014 change in how NFIRS codes cooking-related causes, which USFA reverted for 2015 onward; the data cannot distinguish how much of the shift is real versus an artifact of that coding change. Cooking fires were disproportionately small: they accounted for 60.0% of fires in eating and drinking establishments but only 12.3% of their dollar loss, a mean of about $6,400 per cooking fire against roughly $31,300 per fire from all causes combined and $35,400 per fire for all nonresidential buildings. Electrical malfunction and other unintentional or careless causes, each a much smaller share of fires, accounted for disproportionately more loss. These are descriptive, not causal, findings from USFA’s published aggregate tables rather than fire-incident microdata, and the cause-coding change limits how the within-period trend should be read.
Keywords: restaurant fires; eating and drinking establishments; cooking fires; NFIRS; fire cause; fire loss; food-service safety
Social media summary: Cooking causes 6 in 10 restaurant and bar fires but only 1 in 8 dollars of fire loss, 21 years of USFA data show.
1. Introduction
Restaurants and bars combine two conditions that raise fire risk: continuous cooking with open flame or high heat, and large numbers of people gathered in one place. The US Fire Administration (USFA) has long flagged cooking as the leading cause of fires in this property-use category; its 2015 data snapshot on restaurant fires put cooking at 64% of restaurant fires for 2011–2013, with heating and electrical malfunction each around 7% (USFA, 2015). What that data snapshot does not show is how that distribution has moved over a longer run of years, how it compares with the cause mix in nonresidential buildings generally, or how the share of fires caused by cooking compares with cooking’s share of the resulting dollar loss.
Economic research on fire incidence has used the same underlying National Fire Incident Reporting System (NFIRS; USFA, n.d.-c) data to study how policy changes incidence: using a state-level panel, Markowitz (2014) found that higher cigarette prices were associated with fewer residential fires and deaths, but that laws regulating indoor smoking were associated with more fires overall, and specifically that restaurant and bar smoking bans were associated with an increase in fires at eating and drinking establishments, plausibly because smokers barred from smoking indoors elsewhere have fewer safe places to dispose of a lit cigarette. That paper is a reminder that cause-of-fire statistics for this property type are policy-relevant, not just an insurance curiosity, and that they can move for reasons other than cooking behavior itself. NFPA also publishes its own recurring aggregate reports on fires in eating and drinking establishments; this paper is an independent analysis of USFA’s data rather than a review of that literature, and I have not systematically compared its findings against NFPA’s.
This paper has three aims. First, to describe USFA’s own national estimates of fires, deaths, injuries and dollar loss in eating and drinking establishments for as many years as the agency publishes in one comparable series, 2003–2023. Second, to compare the cause distribution of those fires with the cause distribution for all nonresidential buildings over the same period, to see whether cooking’s role is distinctively large for this property type specifically (as expected) and by how much. Third, to compare cooking’s share of fires with cooking’s share of dollar loss, since a cause that drives most incidents need not drive most of the cost. I report these as a straightforward, transparent read of USFA’s own published tables, not as a new statistical model, and I flag a specific, documented limitation in the cause series that affects how the within-period trend should be interpreted.
2. Methods
2.1 Data and source
The primary data are USFA’s national fire estimates published in the workbook “Residential and nonresidential building fire and fire loss estimates by property use and cause (2003–2023)” (USFA, 2025), downloaded from USFA’s public fire data sets page (USFA, n.d.-a) on 11 November 2026. The workbook reports USFA’s own rounded national estimates of fires, fire deaths, fire injuries and fire dollar loss, by nonresidential building property-use type and, separately, by fire cause, for 2003 through 2023. I used four of its worksheets: the nonresidential property-type series (fires, deaths, injuries, dollar loss by property use, including “Eating & Drinking Establishments” and the “Total Nonresidential Building” figure), the cause-of-fire series for eating and drinking establishments specifically, the same cause series for all nonresidential buildings combined, and the dollar-loss-by-cause series for eating and drinking establishments. Fifteen named cause categories are reported (plus a residual “cause under investigation” category); their definitions, reproduced from the workbook’s own documentation sheet, are summarized in the Research transparency and reproducibility section below. USFA computes these as national estimates by scaling NFIRS-reported building-fire shares to independently published totals from the National Fire Protection Association’s (NFPA) annual Fire Department Survey, with dollar loss further adjusted for inflation using the Consumer Price Index, following its published national-estimates methodology (USFA, n.d.-b); this paper uses USFA’s estimates as published and does not re-derive them from incident-level microdata, which were not accessible within this project’s scope (see Limitations).
A small number of cells for fire deaths, and for a few minor causes, are suppressed by USFA with a “<50” (fires/dollar loss) or “<3”/“5” (deaths) marker where the underlying count is too small for a reliable estimate. For the descriptive statistics in this paper that require a numeric value (cause shares, loss-per-fire ratios), I substituted the midpoint of the suppressed range (25 for “<50” fires, $25,000 for “< $50,000” dollar loss, 1.5 for “<3” deaths); these substitutions affect only categories that are a small fraction of their totals and are documented in the reproducibility package. Years before 2003 are not part of this comparable series as published and are not analyzed. For context only, not as data reanalyzed here, I also cite USFA’s 2015 data snapshot on restaurant fires specifically (a subset of eating and drinking establishments defined by NFIRS incident type and property-use codes; USFA, 2015), which separately reports time-of-day and day-of-week patterns for 2011–2013 that are not available in the property-type/cause workbook used as the primary source here.
2.2 Licensing
NFIRS and USFA’s derived national estimates are works of the United States federal government. Under 17 U.S.C. §105, copyright protection is not available for works of the United States government, placing them in the public domain in the United States (Office of the Law Revision Counsel, n.d.). USFA’s data sets page states that it provides these data “free of charge” (USFA, n.d.-a). No further permission was required to use or redistribute the extracted tables in this paper’s reproducibility package.
2.3 Measures
For each year 2003–2023, I computed eating and drinking establishments’ share of all nonresidential building fires and of all nonresidential building dollar loss. For the cause series, I computed each cause’s share of fires in eating and drinking establishments and, separately, in all nonresidential buildings, for the full 2003–2023 period and for three sub-periods: 2003–2011 (before a documented NFIRS coding change, described below), 2012–2014 (the affected years), and 2015–2023 (after USFA reverted the change). I computed the same cause shares for dollar loss in eating and drinking establishments over the full period, and compared each cause’s share of fires with its share of dollar loss. From the cause and loss series I derived mean dollar loss per fire for cooking fires specifically, for all eating-and-drinking fires, and for all nonresidential building fires, and deaths and injuries per 1,000 eating-and-drinking fires. All percentages are simple ratios of USFA’s published national estimates (sums of published annual or period totals); no sampling-based standard errors are computed, because these are themselves point estimates from USFA’s own national estimation procedure rather than a microdata sample this paper draws directly.
2.4 A documented limitation in the cause series
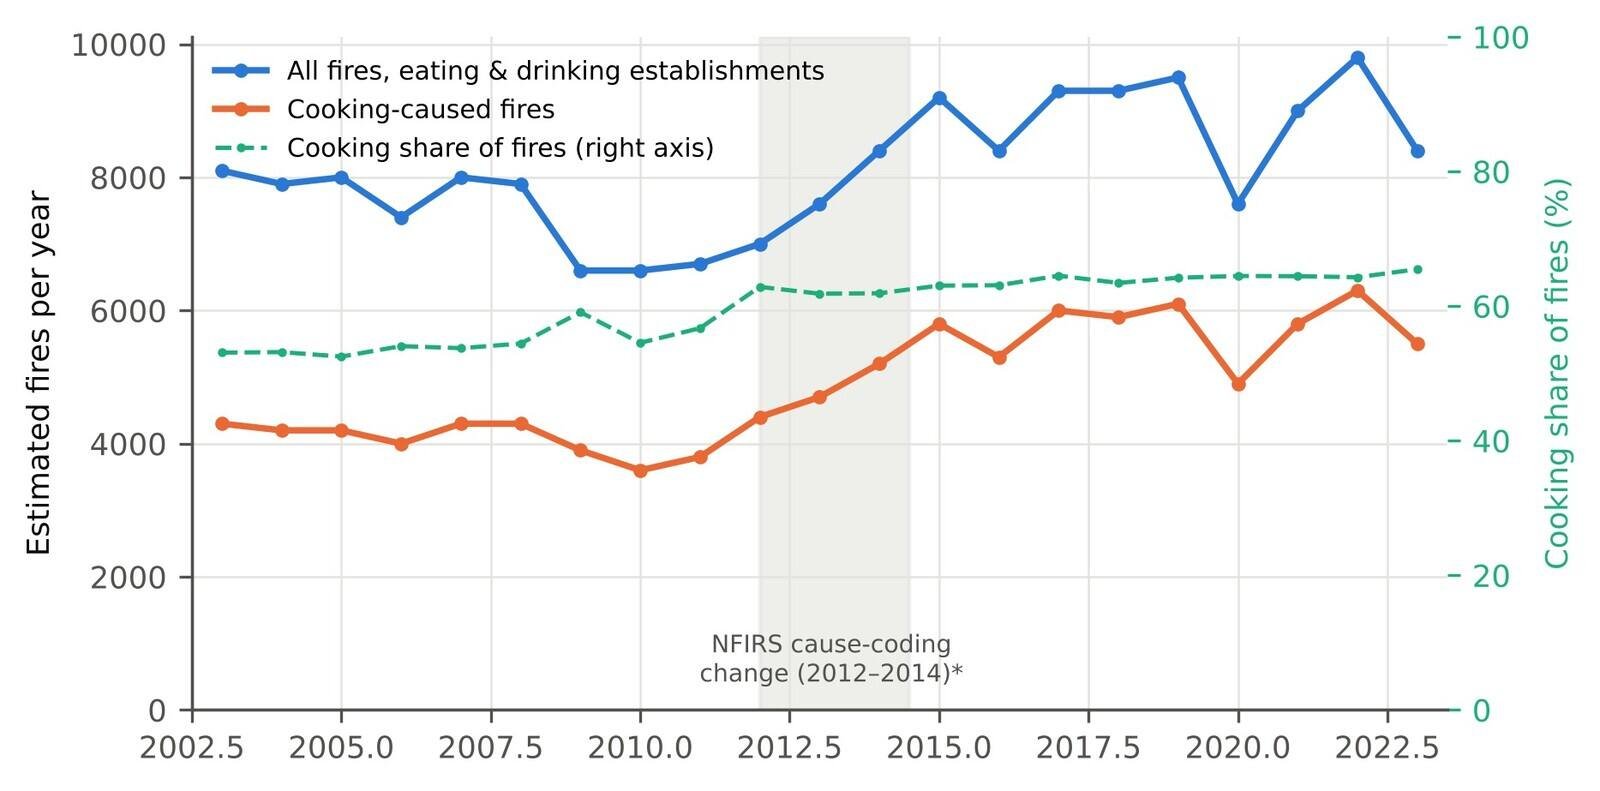
The workbook’s own documentation states: “Beginning in 2012, changes in cooking, electrical malfunction, appliances, and equipment malfunction estimates may be the result of a National Fire Incident Reporting System (NFIRS) edit change … Starting with the 2015 NFIRS data collection, this edit change was reverted back to the way the data were collected prior to 2012” (USFA, 2025). This means the 2012–2014 cooking-share figures in this paper, and part of the step up from the 2003–2011 to the 2015–2023 period, should not be read as straightforwardly as a real behavioral trend; I return to this in the Discussion and report all three sub-periods separately rather than a single pooled trend line.
2.5 Software, data and AI use
Analyses used Python 3.13 with the standard library (csv, json) only; figures used matplotlib. The study was carried out with the assistance of Claude (Anthropic; this build ran on a Sonnet-family model per the project’s November 2026 cost-saving policy for builder agents, not Opus) in November 2026, which retrieved the USFA workbook and USFA web pages in a sandboxed browser, transcribed the relevant tables by hand from the worksheet cells (there being no bulk machine-readable export smaller than the full workbook), wrote and ran the analysis code, verified the one journal citation against Crossref, and drafted the text under the author’s direction. The author reviewed the work and takes full responsibility for it. Independent audits of the numbers and of the cited sources are planned separately and are not reflected in this version.
3. Results
3.1 How many fires, and how much of the nonresidential total
USFA’s estimates put fires in eating and drinking establishments at 8,100 in 2003 and 8,400 in 2023, with a mean of 8,129 fires per year across 2003–2023 (Table 1). The series was not flat: it fell to a low of 6,600 fires in 2009 and 2010, rose through the 2010s, and reached a high of 9,800 fires in 2022 before falling back to 8,400 in 2023 (Figure 1). Across the full period, eating and drinking establishments accounted for a mean of 8.0% of all nonresidential building fires each year (range 7.4% to 9.0%) and for 7.1% of all nonresidential building dollar loss.
Table 1. Estimated fires, deaths, injuries and dollar loss in eating and drinking establishments and in all nonresidential buildings, United States, 2003–2023. USFA national estimates, rounded to the nearest 100 fires/deaths/injuries or as published; dollar loss in nominal $ millions as published (not adjusted for inflation). “<3” marks a USFA-suppressed death cell (fewer than 3 deaths; treated as 1.5 for the ratio calculations in this paper only, see Methods).
| Year | E&D fires | Nonres. fires | E&D share (%) | E&D cooking fires | Cooking share of E&D fires (%) | E&D deaths | E&D injuries | E&D dollar loss ($M) |
|---|---|---|---|---|---|---|---|---|
| 2003 | 8,100 | 103,200 | 7.8 | 4,300 | 53.1 | 5 | 100 | 275.1 |
| 2004 | 7,900 | 101,900 | 7.8 | 4,200 | 53.2 | 5 | 75 | 235.2 |
| 2005 | 8,000 | 101,400 | 7.9 | 4,200 | 52.5 | 5 | 100 | 262.7 |
| 2006 | 7,400 | 98,900 | 7.5 | 4,000 | 54.1 | <3 | 100 | 491.7 |
| 2007 | 8,000 | 103,000 | 7.8 | 4,300 | 53.8 | 5 | 100 | 272.4 |
| 2008 | 7,900 | 97,100 | 8.1 | 4,300 | 54.4 | 5 | 100 | 412.9 |
| 2009 | 6,600 | 89,200 | 7.4 | 3,900 | 59.1 | <3 | 125 | 298.7 |
| 2010 | 6,600 | 84,900 | 7.8 | 3,600 | 54.5 | <3 | 125 | 252.8 |
| 2011 | 6,700 | 85,400 | 7.8 | 3,800 | 56.7 | <3 | 100 | 225.8 |
| 2012 | 7,000 | 92,800 | 7.5 | 4,400 | 62.9 | <3 | 125 | 205.3 |
| 2013 | 7,600 | 93,700 | 8.1 | 4,700 | 61.8 | 5 | 125 | 217.8 |
| 2014 | 8,400 | 99,500 | 8.4 | 5,200 | 61.9 | <3 | 100 | 175.7 |
| 2015 | 9,200 | 104,600 | 8.8 | 5,800 | 63.0 | <3 | 125 | 215.3 |
| 2016 | 8,400 | 96,800 | 8.7 | 5,300 | 63.1 | <3 | 150 | 253.1 |
| 2017 | 9,300 | 111,000 | 8.4 | 6,000 | 64.5 | <3 | 150 | 171.2 |
| 2018 | 9,300 | 103,600 | 9.0 | 5,900 | 63.4 | <3 | 125 | 202.1 |
| 2019 | 9,500 | 110,900 | 8.6 | 6,100 | 64.2 | 5 | 100 | 247.6 |
| 2020 | 7,600 | 103,400 | 7.4 | 4,900 | 64.5 | <3 | 75 | 249.0 |
| 2021 | 9,000 | 116,500 | 7.7 | 5,800 | 64.4 | <3 | 75 | 187.4 |
| 2022 | 9,800 | 129,500 | 7.6 | 6,300 | 64.3 | 10 | 100 | 291.7 |
| 2023 | 8,400 | 110,000 | 7.6 | 5,500 | 65.5 | <3 | 75 | 198.2 |
3.2 Cooking’s share of fires, and a coding-change caveat
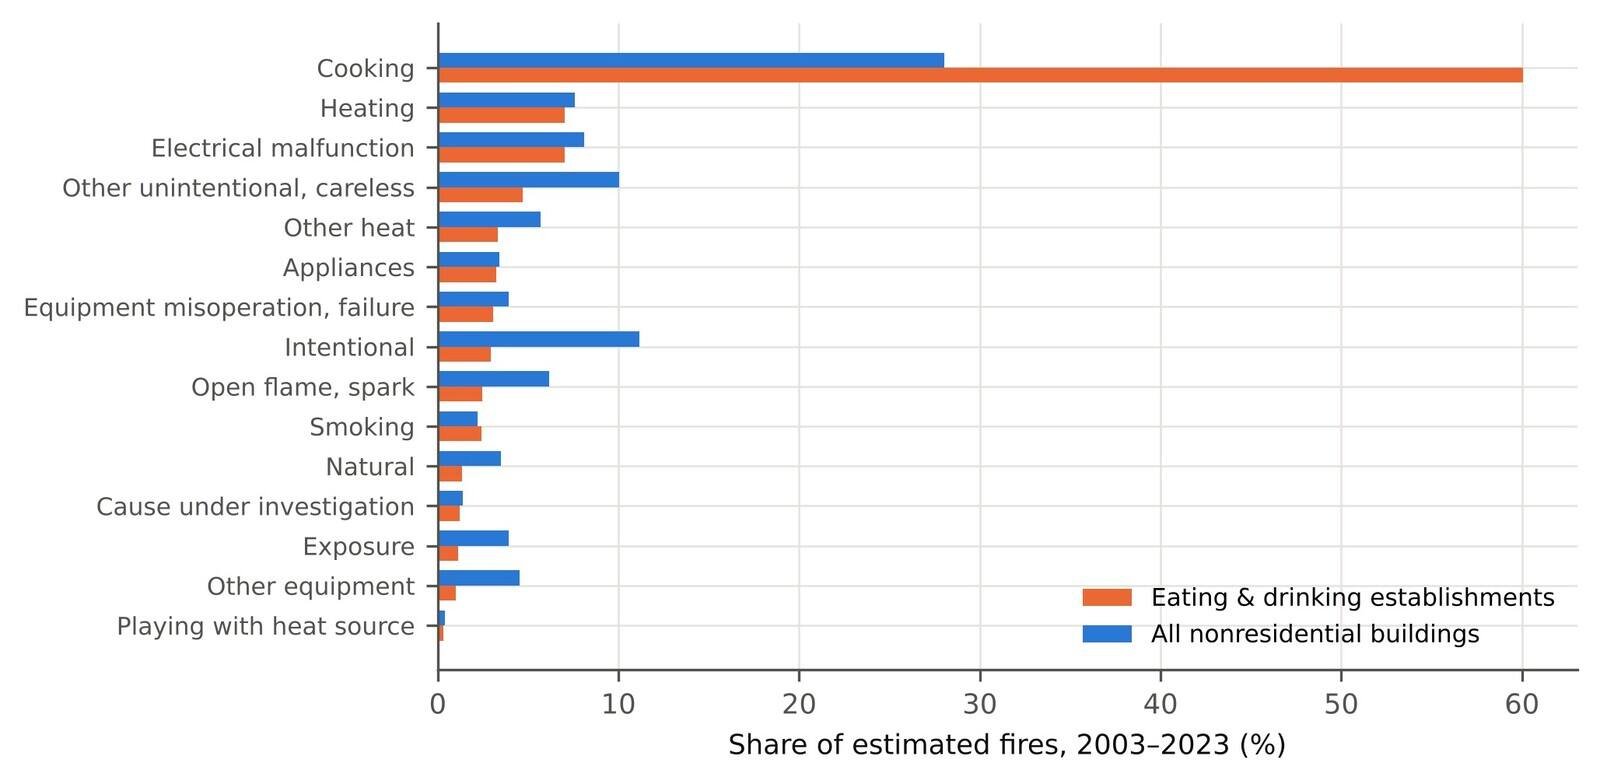
Cooking was the leading cause of fires in eating and drinking establishments in every year of the series. Over 2003–2023 as a whole, cooking accounted for 60.0% of fires, far above its 28.0% share of fires in all nonresidential buildings combined (Table 2, Figure 2). The next-largest causes in eating and drinking establishments, heating and electrical malfunction, each accounted for only 7.0% of fires; all other named causes were smaller still (Table 2).
The cooking share was not constant across the series: it averaged 54.5% in 2003–2011, rose to 62.2% in 2012–2014, and reached 64.1% in 2015–2023 (64.7% in the final three years, 2021–2023; Figure 1). As described in Methods (§2.4), the 2012–2014 window coincides with a documented NFIRS cause-coding change for cooking and several related causes that USFA reverted for 2015 onward; the step from the pre-2012 to the post-2014 level in these data cannot be cleanly separated into a real behavioral change and a coding artifact.
Table 2. Share of fires by cause, eating and drinking establishments vs. all nonresidential buildings, by sub-period, United States, 2003–2023. USFA national estimates. The 2012–2014 period coincides with a documented NFIRS cause-coding change for cooking, electrical malfunction, appliance and equipment-malfunction fires that was reverted for 2015 onward (see Methods and Limitations).
| Cause | E&D 2003–2011 (%) | E&D 2012–2014 (%) | E&D 2015–2023 (%) | E&D 2003–2023 (%) | All nonres. 2003–2023 (%) |
|---|---|---|---|---|---|
| Cooking | 54.5 | 62.2 | 64.1 | 60.0 | 28.0 |
| Heating | 7.9 | 7.4 | 6.2 | 7.0 | 7.6 |
| Electrical malfunction | 9.4 | 6.5 | 5.2 | 7.0 | 8.1 |
| Other unintentional, careless | 4.5 | 3.9 | 5.1 | 4.7 | 10.1 |
| Other heat | 3.7 | 3.0 | 3.1 | 3.3 | 5.7 |
| Appliances | 2.8 | 4.3 | 3.2 | 3.2 | 3.4 |
| Equipment misoperation, failure | 4.5 | 1.0 | 2.5 | 3.1 | 3.9 |
| Intentional | 3.6 | 2.6 | 2.5 | 2.9 | 11.1 |
| Open flame, spark | 2.7 | 2.6 | 2.2 | 2.5 | 6.2 |
| Smoking | 2.4 | 2.6 | 2.4 | 2.4 | 2.2 |
| Natural | 1.3 | 1.3 | 1.4 | 1.3 | 3.5 |
| Cause under investigation | 1.3 | 1.3 | 1.1 | 1.2 | 1.4 |
| Exposure | 1.3 | 1.0 | 1.0 | 1.1 | 3.9 |
| Other equipment | 1.0 | 1.3 | 0.9 | 1.0 | 4.5 |
| Playing with heat source | 0.3 | 0.3 | 0.3 | 0.3 | 0.4 |
3.3 Cooking fires are frequent but comparatively small
Cooking’s share of dollar loss was much smaller than its share of fires: 12.3% of dollar loss in eating and drinking establishments over 2003–2023, against 60.0% of fires (Table 3, Figure 3A). The resulting mean loss per fire was about $6,400 for cooking fires, against roughly $31,300 per fire across all causes in eating and drinking establishments and about $35,400 per fire for all nonresidential buildings (Figure 3B). Electrical malfunction (7.0% of fires but 16.5% of dollar loss) and the residual “other unintentional, careless” category (4.7% of fires but 13.0% of dollar loss) were disproportionately costly by comparison (Table 3).
Across the full period, eating and drinking establishments saw a mean of 0.38 deaths and 13.2 injuries per 1,000 fires (Table 3). These figures sit between USFA’s own separately published 2011–2013 figures for restaurants specifically (0.3 deaths and 11.0 injuries per 1,000 fires) and for other eating and drinking establishments such as bars and nightclubs (1.8 deaths and 8.1 injuries per 1,000 fires; USFA, 2015), consistent with this paper’s eating-and-drinking category being a mix of the two and covering a longer, more recent period.
Table 3. Share of fires and share of dollar loss by cause in eating and drinking establishments, and mean dollar loss per fire, United States, 2003–2023. USFA national estimates; dollar amounts are nominal (not inflation-adjusted).
| Cause | Share of fires (%) | Share of dollar loss (%) |
|---|---|---|
| Cooking | 60.0 | 12.3 |
| Heating | 7.0 | 3.6 |
| Electrical malfunction | 7.0 | 16.5 |
| Other unintentional, careless | 4.7 | 13.0 |
| Other heat | 3.3 | 5.3 |
| Appliances | 3.2 | 6.2 |
| Equipment misoperation, failure | 3.1 | 12.4 |
| Intentional | 2.9 | 8.2 |
| Open flame, spark | 2.5 | 3.0 |
| Smoking | 2.4 | 2.7 |
| Natural | 1.3 | 3.4 |
| Cause under investigation | 1.2 | 7.7 |
| Exposure | 1.1 | 4.7 |
| Other equipment | 1.0 | 1.0 |
| Playing with heat source | 0.3 | 0.0 |
| Measure | Value |
|---|---|
| Mean dollar loss per cooking fire | $6,426 |
| Mean dollar loss per fire, all causes, eating & drinking | $31,293 |
| Mean dollar loss per fire, all nonresidential buildings | $35,449 |
| Deaths per 1,000 E&D fires (2003–2023) | 0.4 |
| Injuries per 1,000 E&D fires (2003–2023) | 13.2 |
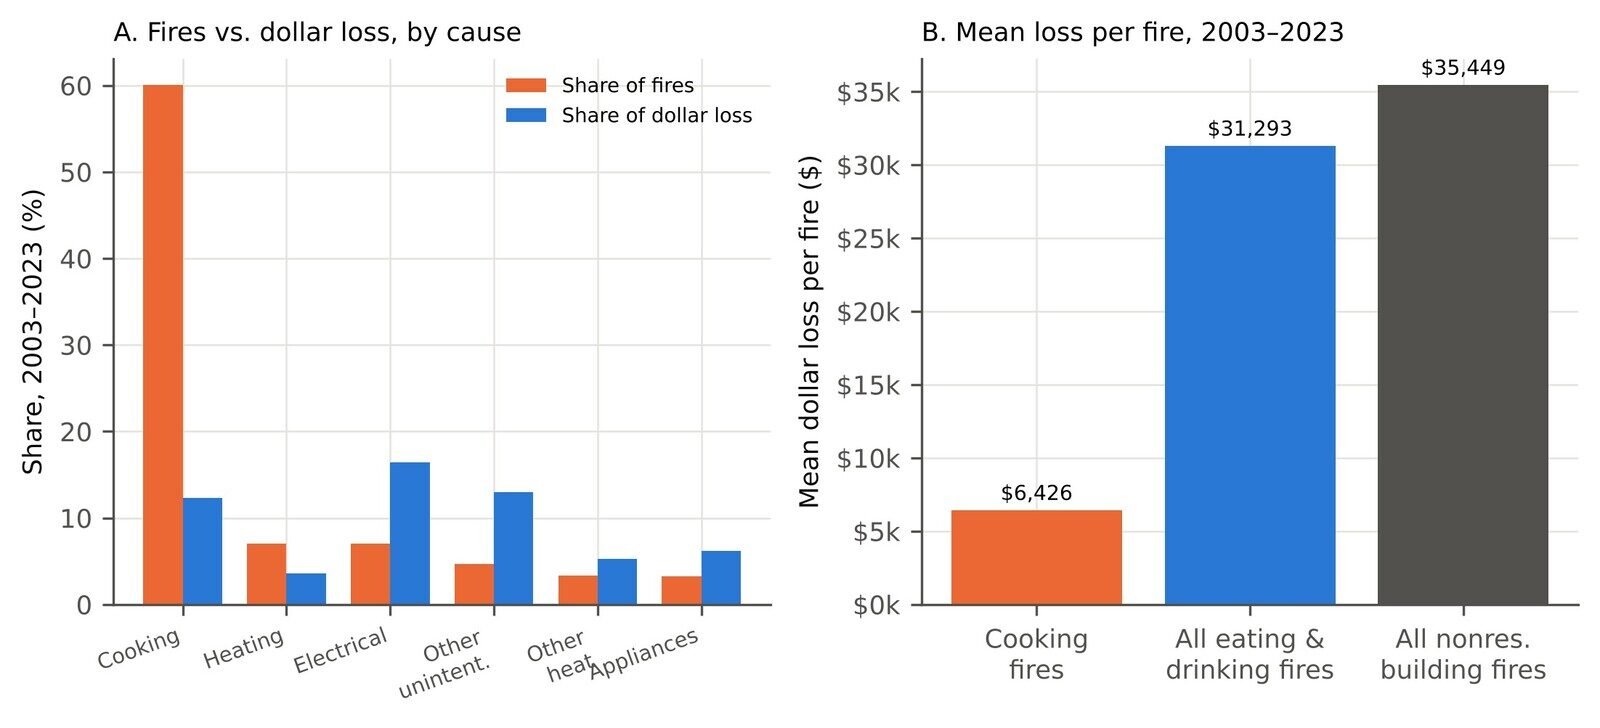
4. Discussion
4.1 What the numbers show
Over 21 years of USFA’s own national estimates, cooking has been, by a wide margin, the leading cause of fires in US eating and drinking establishments, at roughly double its share of fires in nonresidential buildings generally. That is exactly what a cooking-heavy property type should show, and it matches USFA’s own shorter-run restaurant-specific snapshot (USFA, 2015). The less obvious finding is the gap between cooking’s share of fires and its share of dollar loss: cooking fires are frequent and comparatively small, consistent with a confined-fire pattern (a pan fire, a grease flare-up on a stovetop) that is common in commercial kitchens with fire suppression and quick staff response, whereas electrical and “other unintentional” causes, though rarer, are disproportionately associated with larger losses. This paper cannot say why from the aggregate data alone; USFA’s restaurant snapshot reports that about 68% of restaurant fires stayed confined to the object of origin and never spread to the room (USFA, 2015), which is at least consistent with cooking fires being caught early.
4.2 The within-period trend needs a caveat, not a story
The rise in cooking’s share of fires from the 2000s into the 2010s is the kind of pattern that invites a narrative: more aggressive deep-frying menus, more line cooks per shift, less experienced kitchen staff. I do not have evidence for any of that from this data, and the documented 2012–2014 NFIRS coding change for cooking and related causes (USFA, 2025) means the apparent step up in those exact years is at least partly a measurement artifact, not a trend to be explained substantively. The most defensible reading is: cooking’s share was lower before 2012, higher from 2015 on, and the data available here cannot cleanly separate how much of that is real.
4.3 Limitations
This is a description of USFA’s published aggregate national estimates, not an analysis of NFIRS incident-level microdata; the bulk microdata files were not accessible within this project’s scope (see Research transparency and reproducibility), so no analysis of time-of-day, day-of-week, season of year, or incident-level correlates of loss severity was possible here, beyond citing USFA’s own separately published, non-reanalyzed figures for a different (shorter, older) period. The “eating and drinking establishments” category used throughout is USFA’s single combined property-use group; it is not possible from this workbook alone to separate restaurants from bars, nightclubs or cafeterias, which USFA’s own restaurant-specific snapshot shows differ meaningfully in fatality and loss rates (USFA, 2015). Dollar-loss figures are nominal, not adjusted for inflation, so cross-year loss comparisons understate real changes in loss over the 21-year span; this paper’s loss comparisons are cross-sectional (by cause, within the pooled period) rather than year-over-year, which limits the effect of this choice but does not eliminate it. A small number of suppressed cells were assigned a midpoint value to allow percentage calculations; this affects only minor categories and is documented and reproducible. Finally, as discussed above, part of the 2012–2023 rise in cooking’s reported share of fires coincides with a documented coding-system change rather than a confirmed behavioral shift.
5. Conclusion
In USFA’s national estimates for 2003–2023, cooking caused roughly six in ten fires in US eating and drinking establishments, about double its share of fires in nonresidential buildings generally, but accounted for only about one dollar in eight of the resulting loss: cooking fires are frequent and usually small, while rarer electrical and miscellaneous unintentional causes account for a disproportionate share of dollar loss. Part of the apparent rise in cooking’s share after 2012 coincides with a documented change in NFIRS cause coding and should not be read as a confirmed trend. A microdata-level analysis of NFIRS incident records, not attempted here, would be needed to separate the two and to examine time-of-day, seasonal and property-subtype patterns that USFA’s published aggregate tables do not break out.
Related on x9m8
- Regional minimum wages and restaurant employment on Long Island, New York
- Not all eating out: GLP-1 uptake and US restaurant employment by segment, 2019–2025
- Open Questions: a series on what science and law have not settled
Acknowledgements
The author thanks the US Fire Administration for publishing these national estimates free of charge. Claude (Anthropic) assisted with data retrieval, analysis code, citation verification and drafting in November 2026, as described in §2.5. The author reviewed all outputs and is responsible for the content.
Author contributions
P.K. conceived the study, directed the analysis, and reviewed and approved the manuscript.
Financial support
This research received no specific grant from any funding agency, commercial or not-for-profit sector.
Conflicts of interest
The author operates a restaurant (The Heritage Diner) and declares no other financial interest in the fire-protection, insurance or food-service-equipment industries.
Research transparency and reproducibility
All primary data are USFA national estimates, works of the US federal government and in the public domain in the United States (17 U.S.C. §105). The full source workbook is public and free at the URL given in the References; this paper’s reproducibility package extracts only the eating-and-drinking-establishment and all-nonresidential-building rows actually used in the analysis (transcribed by hand from the worksheet cells, since no smaller machine-readable export of just these rows exists), together with their SHA-256 hashes and retrieval dates, rather than redistributing the full multi-sheet workbook. Code and result files are available in the reproducibility package linked from the article page.
References
Markowitz, S. (2014). Where there’s smoking, there’s fire: The effects of smoking policies on the incidence of fires in the USA. Health Economics, 23(11), 1353–1373. https://doi.org/10.1002/hec.2990
Office of the Law Revision Counsel, U.S. House of Representatives. (n.d.). 17 U.S.C. §105 — Subject matter of copyright: United States Government works [as published via the U.S. Government Publishing Office, govinfo.gov]. Retrieved November 11, 2026, from https://www.govinfo.gov/content/pkg/USCODE-2021-title17/html/USCODE-2021-title17-chap1-sec105.htm
U.S. Fire Administration. (n.d.-a). Fire data sets. Federal Emergency Management Agency. Retrieved November 11, 2026, from https://www.usfa.fema.gov/statistics/data-sets/
U.S. Fire Administration. (n.d.-b). National estimates methodology for building fires and losses [PDF]. Federal Emergency Management Agency. https://www.usfa.fema.gov/downloads/pdf/statistics/national_estimate_methodology.pdf
U.S. Fire Administration. (2015, October). Data snapshot: Restaurant fires (2011–2013). Federal Emergency Management Agency. https://www.usfa.fema.gov/statistics/reports/where-fires-occur/snapshot-restaurant.html
U.S. Fire Administration. (2025). Residential and nonresidential building fire and fire loss estimates by property use and cause (2003–2023) [Data set, XLSX]. Federal Emergency Management Agency. https://www.usfa.fema.gov/downloads/xls/statistics/residential-nonresidential-fire-loss-estimates-2003-2023.xlsx
U.S. Fire Administration. (n.d.-c). National Fire Incident Reporting System (NFIRS). Federal Emergency Management Agency. Retrieved November 11, 2026, from https://www.usfa.fema.gov/nfirs/