





Wire a BME280 to a Raspberry Pi, log readings to CSV with Python, and plot them with matplotlib, with the datasheet's accuracy limits and the self-heating caveat spelled out.
Five stages carry a temperature reading from air to chart: a sensor chip, an I2C bus, a Python loop, a CSV file and a plotting script. Each stage is short. The part that takes care is knowing how much the final line on the chart can be trusted, and that answer sits in the sensor’s datasheet.
This tutorial wires a Bosch BME280 to a Raspberry Pi, logs temperature, humidity and pressure to a file, and plots the result with matplotlib. The accuracy figures below come from the Bosch Sensortec datasheet (revision 1.24 as retrieved); the code follows the official docs of each library it calls.
What the BME280 reports, and how well
The chip combines humidity, pressure and temperature sensing in one package. Bosch’s product page describes it only as combining high-linearity, high-accuracy sensors, and the datasheet does not name the transduction principle, so this post does not guess at one. What the datasheet does give is a long list of limits.
| Quantity | Range | Accuracy |
|---|---|---|
| Temperature | -40 to +85 °C operational; full accuracy 0 to 65 °C | ±0.5 °C at 25 °C and over 0 to 65 °C |
| Humidity | 0 to 100 %RH | ±3 %RH (20 to 80 %RH, 25 °C, including hysteresis) |
| Pressure | 300 to 1100 hPa | ±1.0 hPa absolute (0 to 65 °C); ±0.12 hPa relative (700 to 900 hPa, 25 to 40 °C) |
Resolution is a different thing. The chip resolves 0.01 °C, 0.008 %RH and 0.18 Pa at the highest pressure oversampling, but a reading that resolves finely is not thereby accurate. The log will show tidy decimals; the table says how many of them to believe.
Drift matters for a logger that runs for months. The datasheet lists long-term stability of ±0.5 %RH per year for humidity and ±1.0 hPa per year for pressure, and humidity hysteresis of ±1 %RH between 10 and 90 %RH at 25 °C. For weather trends the relative pressure figure is the more relevant one, since a slow fall in pressure is a change measured within a short window rather than an absolute level.
Wiring and checking the chip
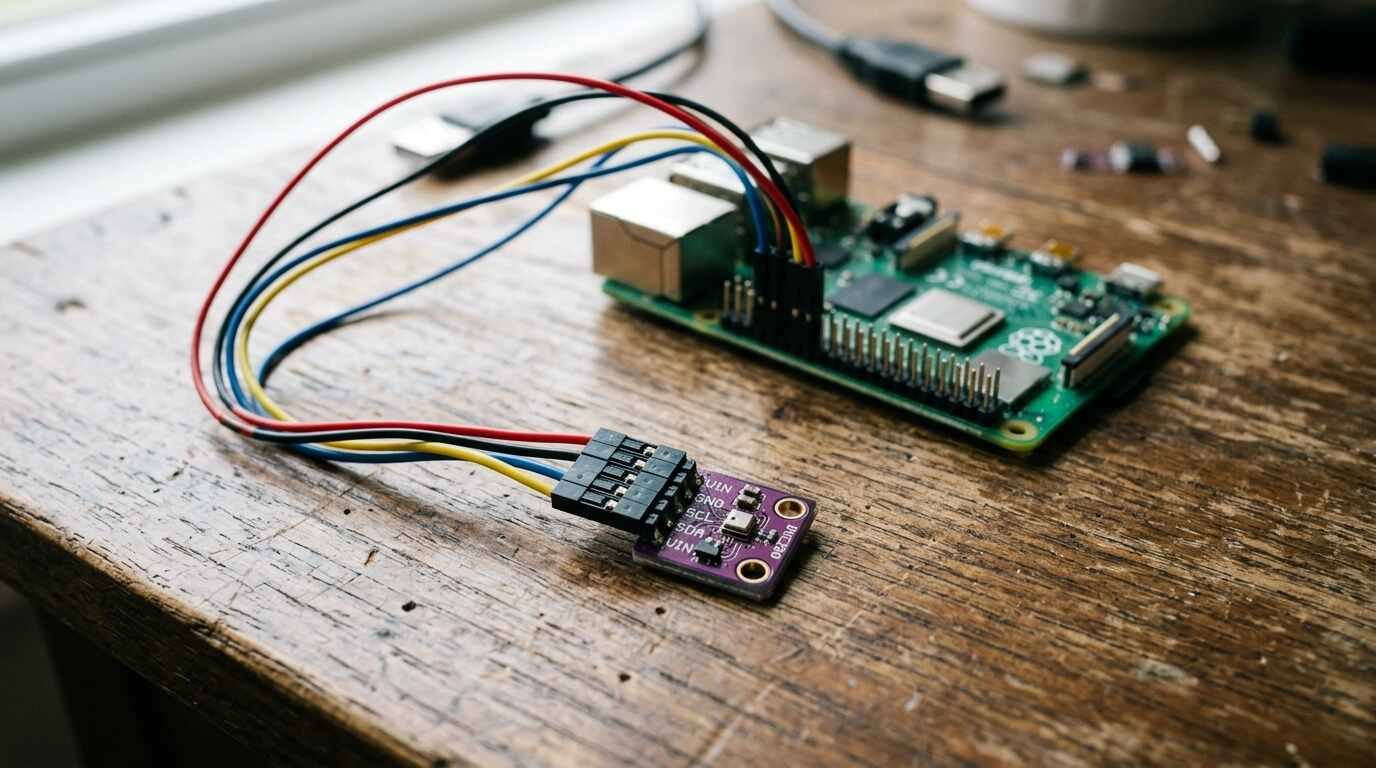
The supply range is 1.71 to 3.6 V (VDD) with 1.2 to 3.6 V for the I/O pins, so use the Pi’s 3.3 V pin. Connect SDA and SCL to the Pi’s I2C pins. The datasheet sets the I2C address by the SDO pin: 0x76 with SDO to ground, 0x77 with SDO to VDDIO, and the CSB pin must be tied to VDDIO to select I2C. Most breakout boards handle both pins for you.
Enable I2C on the Pi, then confirm the address with i2cdetect -y 1, as the RPi.bme280 page suggests. If you need to be sure of the chip, read register 0xD0: a BME280 returns 0x60, while a BMP280 returns 0x56, 0x57 or 0x58. A humidity column that stays empty or constant is a reason to read that register before blaming the code.
Step 1: log to CSV
Install the library with sudo pip install RPi.bme280, per its PyPI page (which also lists i2c-tools and pip as apt packages). The page’s example loads calibration parameters once, then calls sample() for each reading, which returns an object with temperature, pressure and humidity attributes. The script below wraps that call in a loop and writes rows with Python’s csv module, opening the file with newline='' as the csv documentation advises.
import csv
import os
import time
from datetime import datetime

import smbus2
import bme280

PORT = 1
ADDRESS = 0x76          # 0x77 if SDO is tied to VDDIO
FILE = "bme280_log.csv"
INTERVAL_S = 60

bus = smbus2.SMBus(PORT)
params = bme280.load_calibration_params(bus, ADDRESS)

new_file = not os.path.exists(FILE)
with open(FILE, "a", newline="") as f:
    writer = csv.writer(f)
    if new_file:
        writer.writerow(["timestamp", "temp_c", "humidity_pct", "pressure_hpa"])
    while True:
        d = bme280.sample(bus, ADDRESS, params)
        writer.writerow([
            datetime.now().isoformat(timespec="seconds"),
            round(d.temperature, 2),
            round(d.humidity, 2),
            round(d.pressure, 2),
        ])
        f.flush()
        time.sleep(INTERVAL_S)
The f.flush() call pushes each row to disk, so a power cut costs at most one sample. A one-minute interval produces 1,440 rows a day, small enough to open in any spreadsheet. To keep it running after you log out, a service on a Raspberry Pi home server is the usual home for a script like this.
Step 2: plot it
pandas reads the file and turns the first column into a time index in one call: its documentation states that parse_dates=True tries to parse the index, and index_col chooses which column serves as row labels. Matplotlib accepts date values directly, and the Figure.autofmt_xdate method rotates the crowded date labels and right-aligns them.
import pandas as pd
import matplotlib.pyplot as plt

df = pd.read_csv("bme280_log.csv", index_col=0, parse_dates=True)

labels = {
    "temp_c": "Temperature (°C)",
    "humidity_pct": "Relative humidity (%)",
    "pressure_hpa": "Pressure (hPa)",
}

for column, label in labels.items():
    fig, ax = plt.subplots()
    ax.plot(df.index, df[column])
    ax.set_ylabel(label)
    fig.autofmt_xdate()
    fig.savefig(column + ".png")
The script saves one image per column, so each axis stays in its own units; temperature and pressure on one axis would flatten one of them. Give the logger at least a full day before judging the plots, because a daily temperature cycle and a slower pressure trend both need that long to show. After a day of data, the temperature curve will usually be the obvious one. The pressure curve is where the sensor earns its keep, since relative pressure is the best-specified quantity in the table.
When the log comes back empty
Three failures account for most blank starts. The first is a wrong address: the script says 0x76, the board answers at 0x77, and the bus read fails. Run i2cdetect -y 1 and copy whatever address it prints. The second is a disabled I2C interface on the Pi, where the command shows no bus at all. The third is supply voltage. The datasheet caps VDD at 3.6 V, so a bare chip belongs on the 3.3 V pin; whether a given breakout board includes its own regulator is something to read on that board’s own documentation, not assume.
Oversampling and filtering are also adjustable on the chip. The datasheet lets each of humidity, pressure and temperature be skipped or set to x1, x2, x4, x8 or x16, and humidity output is a fixed 16 bits. More oversampling lowers noise at the cost of a longer measurement and slightly more energy per sample. At one reading a minute, the energy cost is irrelevant, which makes higher oversampling a sensible default for a slow logger if your library exposes it.
Self-heating and placement
The datasheet carries a footnote on the temperature reading: it depends on PCB temperature, sensor self-heating and ambient temperature, and is typically above ambient. Bosch gives no correction in the pages used here, so the size of the offset for your board is unknown until you measure it against a reference thermometer.
The chip itself draws little: the datasheet gives 3.6 µA at 1 Hz with all three sensors active and 0.1 µA asleep, and forced mode takes one measurement then returns to sleep. The bigger warm neighbor is usually the board it is soldered to and the computer beside it. As an inference rather than a datasheet figure, mounting the sensor on a short cable away from the Pi, in free air and out of sunlight, removes the largest likely heat sources from the reading.
A final plausibility check costs nothing: compare the first day’s pressure with your local weather service’s reading for the same hour, remembering that your altitude changes the absolute number. If the two curves move together but sit apart by a steady offset, the sensor is behaving as a relative instrument should.
If you still need the computer itself, our review of the CanaKit Raspberry Pi 5 starter kit covers one way to buy it.
Parts list
- BME280 Sensor Module with Jumper Wires, 3-in-1 Temperature Humidity Barometric Pressure Environmental Sensor, I2C SPI Compatible with Arduino, Raspberry Pi, ESP32, ESP8266 (3.3 V, 1-Pack): A 3.3 V BME280 breakout with jumper wires, listed as I2C and SPI compatible. See it on Amazon (affiliate link)
As an Amazon Associate I earn from qualifying purchases. A commission may be earned if you buy through this link, at no extra cost to you.
Sources