




Two ways to build a diffraction-grating spectroscope, how to calibrate it with a fluorescent lamp, and a table for reading LED, CFL, sodium and sky spectra.
Hold a CD at the right angle to a narrow slit of daylight and a rainbow band appears on its surface. Look closely and fine dark lines cut across the band. Astronomers use the same idea at vastly larger scale, and the optics also fit inside a cardboard tube.
A spectroscope has only two jobs: let a thin line of light in, and spread it by wavelength with a diffraction grating. Which colours show up, and whether they form a smooth band or isolated lines, tells you what is making the light. Below are two ways to build one, a calibration step that uses an ordinary fluorescent lamp, and a table for reading what you see. For what professional instruments do with the same idea, x9m8 has a piece on SPHEREx reading 37 brown dwarfs.
Safety before anything else
Never point a spectroscope at the Sun. The Stanford Solar Center’s instructions put it in capitals, adding that the instrument is not a filter and will not protect your eyes. Ohio State’s version warns that the Sun is dangerously bright even at wavelengths you cannot see. The NOAA activity says the same.
Handle grating film by its edges or frame; fingerprints on the surface spoil it. Craft knives and cut aluminium are sharp. If you test flame colours, NOAA warns that burning materials can give off dangerous by-products and calls for a Bunsen burner or propane torch, so treat that as an adult task.
Method one: the cardboard tube
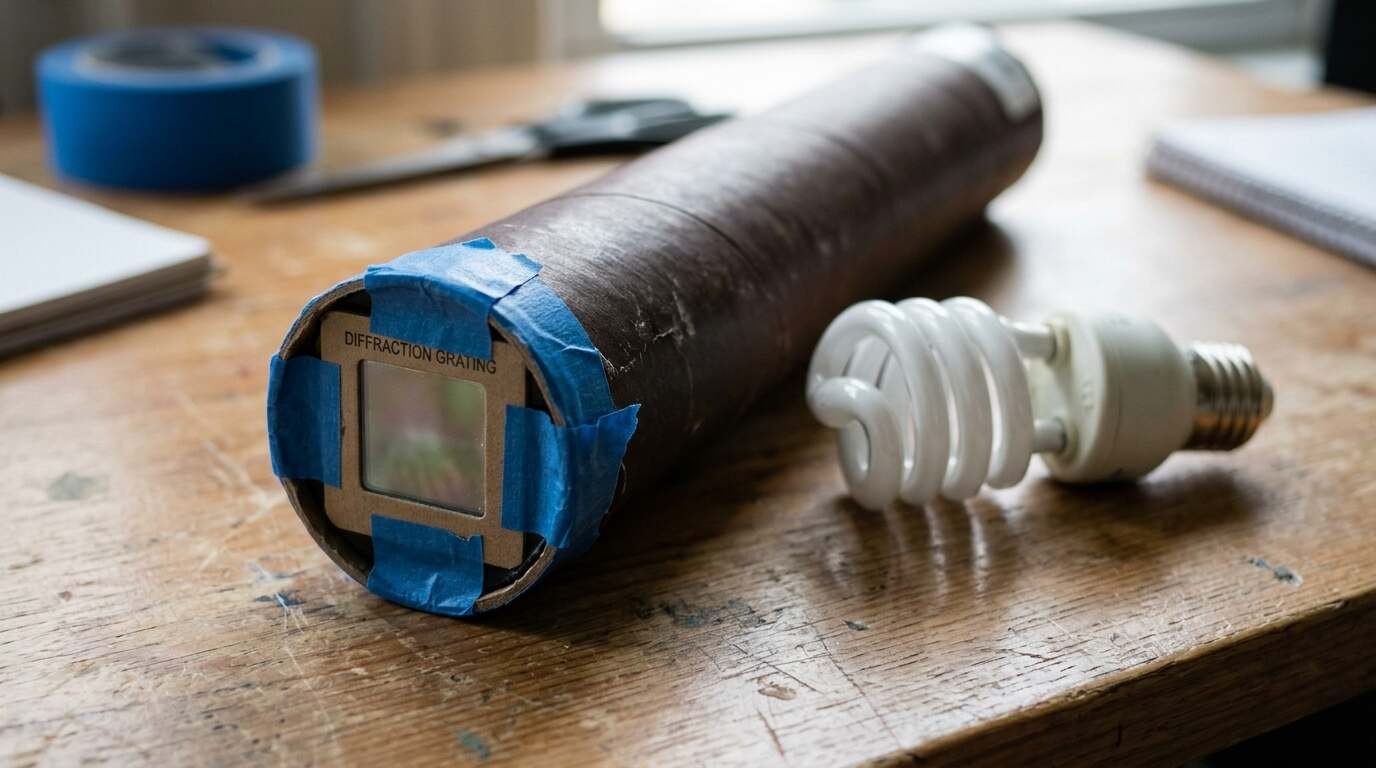
This follows the design on Ohio State’s astronomy site, which uses a thick-walled tube about 1.5 inches across.
- A cardboard mailing or paper-towel tube, thick-walled, with a 1.5 inch diameter
- Holographic diffraction grating film in a 2 x 2 inch slide
- A thick 3 x 5 card, black tape, and a cutting pad
- Scissors, a metal ruler and a fine-bladed knife
Diffraction grating film is sold in slide mounts by science suppliers; the Ohio State page cites Edmund Scientific.
- Tape the grating slide over one end of the tube. The grating’s long axis sets the direction the spectrum spreads.
- Trace the open end of the tube onto the card. Cut a slit about 1 inch long and 0.5 mm wide in the middle, using the metal ruler for clean edges. Expect a few ruined cards before one works.
- Cut out the circle containing the slit. Tape it over the open end, with the slit’s long axis lined up with the grating’s short axis.
- Cover the rest of the opening with black tape so only the slit admits light.
- Point the slit at a lamp and look through the grating from a few inches away, turning your view about 30 degrees to one side.
Method two: a CD and a slit
The simplest instrument comes from the University of Kiel’s astrophysics site and needs no grating film at all. A CD’s tracks act as the grating.
- Darken a room, apart from a small window area lit by bright sky or a sunlit white wall. Direct sunlight is not needed.
- Cut a slit about 1 mm by 5 cm in paper or card and place it over the window with the long side vertical.
- Stand with your back to the slit and hold the CD to see a white reflection of it. A recordable CD-R, silvery for preference, gives brighter reflections.
- Turn the disc so the slit lies where the grooves run parallel to it, then swivel it about a vertical axis until a bright band appears.
- Vary the distance between eye and disc until the dark vertical lines sharpen.
Stanford’s printable cardboard design adds a numbered scale and a hinged cover that darkens it, which makes faint lines easier to read.
Calibrating the scale
A spectroscope without a scale shows patterns, not wavelengths. Fluorescent lamps solve that. Both the NOAA activity and Public Lab’s CFL work name two reference lines, a purple one at 436 nm and a green one at 546 nm, both visible in fluorescent light. Find them in a compact fluorescent lamp’s spectrum, mark them on your scale or on photos taken through the grating, and every other line can be placed relative to them.
Public Lab’s reference list also gives the green doublet in a CFL as 543.5 and 546.07 nm, a pair about 4 nm apart, and a strong red line at 611.6 nm. Tube lamps behave differently: a Public Lab contributor measured a single green peak near 547 nm instead of a pair, and hypothesised that the other green line in a CFL comes from a phosphor such as terbium.
Getting a sharper image
Most trouble traces back to the slit and to stray light. Ohio State’s slit is about 1 inch long and 0.5 mm wide, and the author needed three attempts to cut one cleanly, so budget extra card. Stanford’s template sets the slit gap at about 1/16 inch with spacers and tells builders to keep tape clear of the opening.
Light leaks wash out faint lines. Stanford asks for crisp, scored folds so the body is light-tight, and its hinged scale cover exists for the same reason: close it to darken the scale, lift it to read. For the tube version, black electrical tape over the unused part of the end card does the equivalent job.
On calibration, Stanford’s scale is marked in angstroms. Its instructions slide the scale until the 5450 line meets the green fluorescent line, which is the same green near 546 nm that NOAA and Public Lab use. Other lines are then read off that scale, though the sources give no accuracy figure for the result.
Reading the spectra
| Light source | What to expect | Reference |
|---|---|---|
| Incandescent bulb | Smooth continuous rainbow from the hot tungsten filament | Ohio State |
| Compact or tube fluorescent | Sharp mercury lines (546 nm among them) over broad phosphor bands; 436 nm serves as a calibration line | Ohio State, Public Lab, NOAA |
| White LED | A sharp blue or violet peak plus broad phosphor emission | University of Colorado |
| Low-pressure sodium lamp | Two narrow lines at 589.0 and 589.6 nm; light looks orange | RP Photonics |
| High-pressure sodium lamp | Broadened sodium emission in red, orange and yellow plus mercury green, blue and violet; looks white with an orange tint | RP Photonics |
| Bright sky or sunlit white wall | Continuous band crossed by dark Fraunhofer lines; sodium D in the orange and magnesium b in the green are easiest | Kiel |
Neon signs are an obvious candidate for the list, but none of the sources used here describes their lines, so no neon claims appear above. The Ohio State page does suggest pointing your instrument at neon signs and screens to see what appears.
Finding Fraunhofer lines
Joseph von Fraunhofer discovered the dark lines in 1814, and in 1859 Kirchhoff and Bunsen showed that each element has characteristic lines, per Kiel. NOAA’s table of solar lines lists, among others, hydrogen at 486.1 nm (F) and 656.3 nm (C), magnesium near 517 to 518 nm (b), and sodium at 589.0 and 590.0 nm (D2 and D1), plus calcium at 393.4 and 396.8 nm in the violet.
Use sky light or a sunlit wall, never the Sun itself. Kiel’s CD method names the D line and the green magnesium b line as the easiest. Whether a simple tube resolves more depends on slit width and grating, and the sources used here give no guidance, so treat additional lines as a bonus.
Sodium’s D lines turn up in two places in this project: dark in sky light, bright in a sodium lamp. NOAA’s activity asks learners why the solar lines are black and leaves the question open for them to work out. For another case of light used as a probe, see x9m8’s article on two labs, one electron lattice and the light that exposed it.
Sources
- Stanford Solar Center, Make Your Own Spectroscope
- Ohio State University Astronomy, Hand-held spectrograph
- University of Kiel, How to see the spectral lines of the Sun
- NOAA SWPC, Spectroscope activity (PDF)
- Public Lab, CFL calibration discussion
- University of Colorado Physics Labs, Three White Lights
- RP Photonics, Sodium Vapor Lamps