

Preprint, version 1 (October 2026). Not peer reviewed. This is the author’s manuscript, prepared for submission to a peer-reviewed journal. Download: PDF · Word · reproducibility package (zip) · code on GitHub with code, results and the two independent audits.
Cite as: Kalafatis, P. (2026). Paying for protein: Protein-named US packaged foods, nutrients and breakeven prices [Preprint]. x9m8.com. https://doi.org/10.5281/zenodo.23807436
Peter Kalafatis
Independent researcher, x9m8.com, New York, NY, USA. Correspondence: x9m8x7@gmail.com
Version 1, October 2026.
Abstract
US evidence on what protein-marketed foods contain and what their protein costs rests mostly on proprietary data. Using USDA FoodData Central Branded Foods (April 2026 release; 462,142 current US products), I compared 6,011 products with “protein” in their name, brand or sub-brand against 192,025 other products in the same 34 categories and with 594 same-brand lines. In a hand-coded sample, 98.7% of names were protein-content messages. Of protein-named products, 88.2% declared at least 10 g of protein per labelled serving, yet they were only 20.3% of products that did. Within categories, protein-named products had 22.9 g more protein per 100 g, 3.6 g less added sugar and 34 mg more sodium per 100 kcal, and more often contained non-sugar sweeteners (58.4% vs 7.7%), confirming German and Spanish findings; within brand lines the differences were smaller but mostly in the same direction. At 2025–2026 Bureau of Labor Statistics prices, dried beans, eggs, whole milk and boneless chicken breast supplied 10 g of protein for US$0.17–0.41. Product-specific breakeven prices, at which a product’s protein would cost the same as from the median of these foods, had a median of US$0.49 per serving (interquartile range across products 0.36–0.65). At GroceryDB’s 2021 shelf prices, 94.9% of protein-named items exceeded that cost per gram of protein. In the median brand line, protein-named products carried 1.66 times the protein per 100 g, so a premium below 66% would still lower their cost per gram of protein. The label marks real protein; cheap protein is in staples.
Keywords: protein claims; front-of-pack marketing; packaged foods; food prices; protein cost; non-sugar sweeteners; ultra-processed foods; FoodData Central; nutrition labelling
Social media summary: For a typical “protein” food, eggs and beans give cheaper protein above ~49¢ a serving; milk and chicken above 61¢.

1. Introduction
Protein has become one of the most visible selling points in the grocery aisle. Using the Mintel new-products database, Lee et al. (2024) counted 289 high-protein supplement and drink launches (ready-to-drink and powder) worldwide in 2013 and 1,230 in 2023; conventional foods were outside their scope. On US shelves, bars, shakes, cereals, chips, cookies, pasta and milk are now sold in versions that put protein in the product name. US federal rules allow a “high” or “excellent source” protein claim when a food supplies at least 20% of the Daily Value per reference amount customarily consumed, and a “good source” claim at 10–19% (21 CFR 101.54(b)(1), (c)(1)). Meal and main-dish products follow separate rules (21 CFR 101.54(b)(2), (c)(2)), and “more”, “added”, “extra” or “plus” protein claims are relative claims against a reference food (21 CFR 101.54(e)). The Daily Value for protein is 50 g for adults and children aged 4 years and older (21 CFR 101.9(c)(7)(iii)). When a protein claim is made, the protein %DV must be declared, and it must be corrected for protein quality (21 CFR 101.9(c)(7)(i)–(ii)).
Three questions follow for shoppers and for public health. First, do the products that market protein actually carry much of it? Second, what else comes with it? A Spanish study of 4,325 processed foods classified 90.8% of products with protein claims as “less healthy” under the Pan American Health Organization nutrient profile model, and found more of them high in sodium than products without claims (Beltrá et al., 2024). In Germany, Koop et al. (2024) compared 299 high-protein with 286 normal-protein ultra-processed foods: the high-protein products had less sugar and fat but more salt and more additives, including persistent non-nutritive sweeteners, sugar alcohols and flavourings, and cost on average 132% more. A preliminary US abstract using the commercial Label Insight database reported that protein claims were most common, relative to category size, in dairy, frozen foods and cereals, and compared nutrient content between products with and without claims (McKeon & Hallman, 2019). In an online experiment with 1,022 US adults, participants rated a protein version of a breakfast cereal as healthier than the original, although per cup it had more sugar, sodium and calories (McKeon & Hallman, 2024). A study of 145,609 US product launches from 2015 to 2024 concluded that on-package claims are “imperfect signals of overall nutritional quality”, but it grouped protein claims with other “Plus” claims and did not analyse prices (Zhou et al., 2026). Earlier US work on “low” claims found that purchases carrying a given low-content claim did not necessarily have better overall nutrient profiles than purchases without one (Taillie et al., 2017), and a systematic review found that health-related claims have a substantial effect on choices, mostly in artificial settings (Kaur et al., 2017).
Third, what is the protein worth? Besides the German study, a consumer organisation and a news outlet outside the US have tried to measure the “protein premium” directly. An audit by the Australian consumer organisation CHOICE compared 175 supermarket products labelled as high-protein with their regular versions and reported paying “around 50% more per 100 grams” for products promoting protein (Rafferty, 2026). A news report in the Irish outlet The Journal compared the high-protein and normal versions of 10 products and found an average mark-up of 31% per 100 g or 100 ml, yet a lower price per gram of protein in most protein versions (Flynn, 2026). The two findings are not contradictory: a product can cost more per 100 g and less per gram of protein at the same time. Which matters depends on the yardstick. Drewnowski (2010) showed that protein is associated with higher price per 100 g after adjustment for energy, and later work priced protein from dairy, eggs, beans and pulses per gram (Drewnowski, 2025; Drewnowski & Conrad, 2024). To my knowledge, no US study has used open label data to compare protein-marketed packaged foods with same-category and same-brand products and to express their value as breakeven prices against whole-food protein costs; earlier work used proprietary or non-US data (Beltrá et al., 2024; Koop et al., 2024; McKeon & Hallman, 2019; Zhou et al., 2026).
The obstacle is price data. Current US product-level prices are held mostly in proprietary scanner panels and retailer systems. The main open alternative, GroceryDB, publishes shelf prices collected in 2021 for about 50,000 items from Walmart, Target and Whole Foods (Ravandi et al., 2025), but it covers three retailers, predates the label data by several years and carries no GTINs to link it to FoodData Central, so I use it as an external check rather than as the main price source. Label data, by contrast, are public, current and close to a census. This paper therefore (a) describes protein-named products in USDA FoodData Central Branded Foods against comparable products, (b) checks how many would plausibly qualify for a protein claim on label protein alone, (c) expresses value as a breakeven price: the price per serving at which a product would supply protein as cheaply as staple whole foods priced by the US Bureau of Labor Statistics, and (d) checks those thresholds against observed 2021 prices in GroceryDB. The study measures marketing in product names, not front-of-pack claims, and it does not observe what the products in FoodData Central cost.
2. Methods
2.1 Data and sample
I used the FoodData Central Branded Foods CSV release dated 30 April 2026 (US Department of Agriculture, Agricultural Research Service [USDA ARS], 2026), a public database of label data from branded foods collected through a public-private partnership. It was the latest Branded Foods release when the data were retrieved on 22 October 2026. The release has 1,999,950 records and 465,110 distinct GTIN/UPC codes. For each code I kept the latest record (highest fdc_id), then kept products whose market country was the United States (spelled “United States” or “US”; 464,002) and that had no discontinued date (462,142). Leading-zero variants of the same code were collapsed to the latest record.
Exposure was defined from text. A product was protein-named (E2) if “protein” appeared anywhere in its description, brand name or sub-brand name, case-insensitively. A subset was claim-worded (E1) if the text also matched a pre-specified list of claim-like phrases: “high protein”, a number of grams followed by “protein” (for example “20 g protein”), “protein+” or “protein plus”, “good/excellent/great/rich source of protein”, “extra/added/more/max/double/triple/mega/super protein”, and “protein-rich/-packed/-powered/-boost”. FoodData Central has no field for front-of-pack claims, so these tiers measure protein marketing in the name only.
The analysis was restricted to the 34 branded_food_category values with at least 20 current US protein-named products; 438 protein-named products in smaller categories were excluded. I removed records with missing protein or energy and records with implausible values (protein below 0 or above 100 g per 100 g, energy above 950 kcal per 100 g, protein plus fat plus carbohydrate above 105 g per 100 g, sodium above 40,000 mg, added sugars or saturated fat above 100 g per 100 g). The analysis sample was 198,036 products, of which 6,011 were protein-named and 891 claim-worded.
To estimate how often the name rule picks up a genuine protein-content message, a random sample of 300 protein-named products (seed 20261022) was coded by one rule: does “protein” in the name tell the shopper about the product’s protein content (positive), or does it name a substance or appear incidentally (negative)? Coding was done by the AI assistant under the author’s direction and reviewed; a second independent human coder was not used. The 95% confidence interval for precision is a Wilson interval.
2.2 Outcomes
Nutrients are reported in FoodData Central per 100 g (or 100 ml). I used protein, energy, added sugars, total sugars, sodium, saturated fat and dietary fibre, expressed per 100 g, per 100 kcal (for products with at least 10 kcal per 100 g) and per 10 g of protein (for products with at least 1 g protein per 100 g), as well as the share of energy from protein (4 kcal per gram).
Label protein per serving (E3). For products with a serving size in grams or millilitres, protein per labelled serving was protein per 100 g × serving size / 100, rounded to the nearest gram. Servings were grouped as under 5 g, 5–9 g (the “good source” range) and 10 g or more (the “high” range). This is an upper bound on claim eligibility, because the legal test uses the reference amount customarily consumed and quality-corrected protein, neither of which is in the database.
Ingredient markers. Ingredient statements were searched with pre-specified regular expressions for nine classes, chosen with reference to the substances and cosmetic additives that characterise the NOVA ultra-processed group (Monteiro et al., 2019): protein isolates, concentrates or hydrolysates (including whey, milk, soy and pea protein, caseinates and collagen); non-sugar sweeteners and polyols; flavourings; flavour enhancers; colours; emulsifiers; thickeners and gums; sugar- or fibre-type substances (for example maltodextrin, dextrose, high-fructose corn syrup, soluble corn fibre, inulin); and hydrogenated or interesterified oils. Outcomes were the number of classes present (0–9), the same excluding protein isolates (0–8), and the presence of each class. Collagen or gelatin was flagged separately. The number of top-level ingredients was counted as commas outside brackets plus one. These markers are not a NOVA classification; they are a transparent count of additive classes.
2.3 Comparisons
C1, same category. Within each category, I computed the median (or percentage) for protein-named products and for products that were not protein-named, and their difference. Category differences were averaged with weights equal to the number of protein-named products with data; categories with fewer than five products in either group for an outcome were skipped. Confidence intervals came from 1,000 bootstrap replicates, resampling each group within each category. As sensitivity analyses I repeated C1 within strata of category × within-category energy-density quintile, for claim-worded products only, and for products made available from 2023 onwards. The last matters because added sugars, which entered the Nutrition Facts label with the 2016 rule, were reported for only 32.8% of current US products overall and for a much larger share of recent ones.
C2, same brand line. A brand line was the combination of brand owner, brand name (or owner if blank) and category, after normalising case and punctuation. Lines containing both protein-named products and products without “protein” in the name formed twin groups. For each group I took the difference in medians (or percentages) between the two kinds of product, and summarised groups by the median difference for continuous outcomes and the mean difference for percentages, with bootstrap 95% CIs over groups (1,000 replicates). Wilcoxon signed-rank tests on non-zero group differences were adjusted for multiple outcomes with the Holm method.
2.4 Prices and breakeven
Whole-food prices were the US city average series from the Bureau of Labor Statistics (BLS) Average Price Data for October 2025 to September 2026 (BLS, 2026). No October 2025 value was published for the series used, so the mean covers 11 months. Four foods served as benchmarks: grade A large eggs (per dozen), whole milk (per gallon), dried beans (per pound) and boneless chicken breast (per pound). Seven others are shown for context: low-fat milk, two grades of ground beef, cheddar cheese, yogurt, white bread and white rice. Edible grams per pricing unit were 600 g per dozen eggs (50 g per large egg), 3,904 g per gallon of milk (976 g per quart), 453.6 g per pound and 227 g per 8 oz of yogurt. Protein and energy per 100 g came from SR Legacy (USDA ARS, 2018), using raw foods (for beans, the mean of pinto, black, red kidney, navy and great northern beans). Cost per gram of protein was price / edible grams / (protein per gram). Protein quality corrections were not applied.
The breakeven price per serving of a protein-named product was its label protein per serving × the benchmark cost per gram of protein; above that price the benchmark supplies protein more cheaply. A breakeven price per package used protein per 100 g × package weight, parsed from the free-text package_weight field (metric amounts preferred; amounts below 5 or above 20,000 g or ml discarded; 1 g taken as 1 ml in the 0.7% of parsed records whose package unit differed from the nutrient basis). Package weights may describe one unit or a multipack, so per-serving values are the main result.
Brand-line premium. In each twin group with protein in the comparator, the ratio of the median protein per 100 g of protein-named to other products, r, gives the largest price premium per 100 g, r − 1, at which the protein-named product would still be the cheaper source of protein. At a premium p, protein per dollar changes by a factor r / (1 + p). I evaluated three non-US premiums per 100 g as scenarios, not as US estimates: 31% from a news report (Flynn, 2026), 50% from a consumer-organisation audit (Rafferty, 2026) and the 132% mean premium from a peer-reviewed German study (Koop et al., 2024).
2.5 External check with observed prices
GroceryDB’s public file GroceryDB_foods.csv (GitHub repository Barabasi-Lab/GroceryDB, file version of commit a8d541c, MIT licence) gives, for each item, the store, shelf price, package weight and nutrients per 100 g (Ravandi et al., 2025). I selected items with “protein” in the name (excluding “no protein”, “low protein” and “protein free”) and with protein between 0 and 100 g per 100 g. Because the package-weight field contains evident errors, the main check kept only items whose package weight agreed within 15% with the size stated in the item name. Observed cost per 10 g of protein was price / (protein per 100 g × package weight / 100) × 10. A product’s price is above its breakeven price exactly when its cost per gram of protein is above the benchmark’s, so the share of items above each benchmark shows how often the thresholds are exceeded in practice. The GroceryDB prices are from 2021 and the benchmarks from 2025–2026, so I also report the cost of protein from plain eggs (sold by count) and plain boneless chicken breast priced in GroceryDB itself.
2.6 Software, data and AI use
Analyses used Python 3.13 with pandas, NumPy and SciPy; figures used matplotlib. Because the build environment could not download the FoodData Central zip directly, the release was read in a browser tab with a script included in the package, which wrote extract files of the needed columns; these were checked against independent counts of records and codes. The study was carried out with the assistance of Claude (Anthropic; model claude-opus-5-5) in October 2026, which retrieved data, wrote and ran the analysis code, coded the validation sample, searched the literature and drafted the text under the author’s direction. The author reviewed the work and takes full responsibility for it.
3. Results
3.1 How common are protein-named products?
Of 462,142 current US products, 6,829 (1.5%) had “protein” in the name, brand or sub-brand. In the 34 analysed categories, 6,011 of 198,036 products (3.0%) were protein-named and 891 (0.4%) were claim-worded. Two categories, snack, energy and granola bars (2,307 products) and energy, protein and muscle recovery drinks (1,350), held 60.8% of protein-named products; the rest were spread across chips, cookies, milk, cereals, powdered drinks, chocolate and 26 other categories. In the validation sample, 296 of 300 names were protein-content messages (precision 98.7%, 95% CI 96.6–99.5%). The four exceptions were two meat alternatives whose name used “protein” for the food itself, one name listing ingredients, and one apparent personal-care item filed under cake mixes.
3.2 Do protein-named products carry protein?
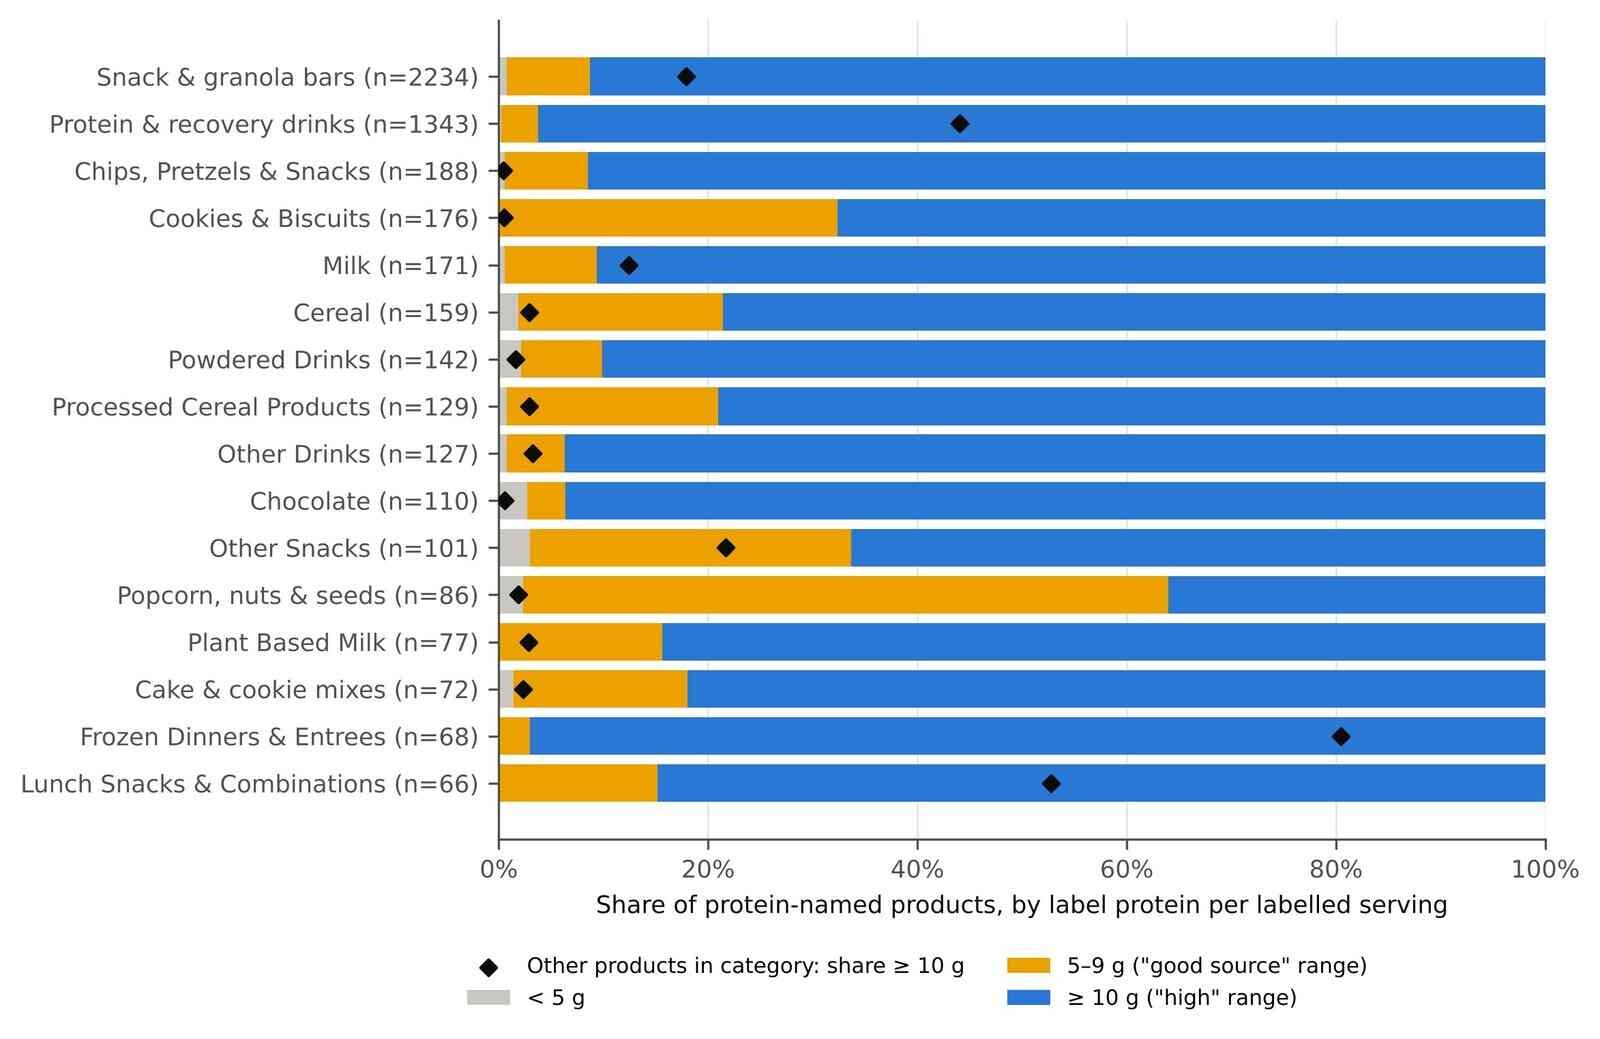
Mostly, yes (Table 1, Figure 1). Among protein-named products with a usable serving size (n = 5,914), 88.2% declared at least 10 g of protein per labelled serving, 10.8% 5–9 g and 1.0% under 5 g; the median was 15 g. Among claim-worded products the share with at least 10 g was 93.6% and the median 20 g. The shortfall was concentrated in a few categories: under 5 g per serving was found in 12.7% of protein-named prepared meat products and 13.6% of milk or milk substitutes, against under 3% in most categories.
The converse is the larger gap. Of the 195,110 products with a usable serving size, 25,703 declared at least 10 g per serving, and only 20.3% of those were protein-named; 20,485 products in the same categories reached the “high” range without saying so in the name; just over half of them (53.5%) were frozen dinners (4,247), yogurts (2,504), frozen appetizers (2,302) or other meats (1,906). By this measure the name is a specific signal of protein, but not a sensitive one.
Table 1. Label protein per labelled serving, by name tier. US products in FoodData Central Branded Foods (release 2026-04-30), latest record per GTIN, not discontinued, in the 34 categories with at least 20 protein-named products, with a gram or millilitre serving size. Protein per serving was computed from the per-100 g value and rounded to the nearest gram. Under 21 CFR 101.54(b)(1) and (c)(1) a “high” claim requires 20% of the 50 g Daily Value (10 g) and a “good source” claim 10–19% (5–9.5 g) per reference amount customarily consumed, after correction for protein quality; meal and main-dish products follow separate rules (101.54(b)(2), (c)(2)). The columns are therefore an upper bound on eligibility.
| Name tier | Products | < 5 g | 5–9 g | ≥ 10 g |
|---|---|---|---|---|
| E1: claim-like wording (“high protein”, “20 g protein”, “protein+”) | 873 | 9 (1.0%) | 47 (5.4%) | 817 (93.6%) |
| E2 only: “protein” elsewhere in name, brand or sub-brand | 5,041 | 48 (1.0%) | 592 (11.7%) | 4,401 (87.3%) |
| Not protein-named | 189,196 | 122,720 (64.9%) | 45,991 (24.3%) | 20,485 (10.8%) |
3.3 What else comes with the protein?
Table 2 and Figure 2 summarise composition. Within categories, protein-named products had a median of 25.6 g of protein per 100 g against 6.5 g for other products (category-weighted difference 22.9 g, 95% CI 22.3–23.4); protein supplied a median 33.3% of their energy against 7.2%. Energy per 100 g did not differ in the pooled medians (380 vs 381 kcal), but the category-weighted difference was 46.1 kcal (35.8–48.4): within their own categories, protein-named products tended to be more energy-dense.
Per calorie, protein-named products had less sugar and more sodium. Added sugars were 1.44 against 6.25 g per 100 kcal (difference −3.61 g, −3.86 to −3.28), lower in 25 of 32 categories with enough data; total sugars showed the same pattern. Sodium was 95.7 against 66.7 mg per 100 kcal (difference 34.3 mg, 31.6–36.8), higher in 26 of 34 categories. Saturated fat per 100 kcal was slightly higher (0.13 g, 0.10–0.17), and fibre per 100 kcal was higher (0.54 g, 0.45–0.62). Expressed per 10 g of protein, every one of these “costs” was lower for protein-named products, because their protein density was so much higher: 1.79 against 25.0 g of added sugars and 117 against 300 mg of sodium per 10 g of protein.
Ingredient lists were longer (median 14 against 8 ingredients, although the within-category difference was only 0.36, −0.29 to 0.86) and contained more additive classes (median 4 against 2 of 9; within-category difference 1.07, 0.99–1.33). Part of this is by construction: 86.9% of protein-named products contained a protein isolate, concentrate or hydrolysate, against 10.5% of other products. Excluding that class, the within-category difference was 0.76 classes (0.72–1.02). The largest single difference was in non-sugar sweeteners and polyols, present in 58.4% of protein-named products and 7.7% of others (within-category difference 33.3 percentage points, 31.6–34.8). Flavourings (85.8% vs 58.4%) and emulsifiers (58.4% vs 30.0%) were also more common.
Table 2. Composition of protein-named (E2) products compared with other products in the same category (C1) and with the same brand line’s products in the same category that do not use the word (C2). Per-100 kcal outcomes exclude products under 10 kcal per 100 g; per-10 g-protein outcomes exclude products under 1 g protein per 100 g. C1: medians (or percentages) over all products, and the within-category difference averaged across categories with weights equal to the number of protein-named products (bootstrap 95% CI, 1,000 replicates). C2: 594 brand-line groups (brand owner × brand × category) containing both kinds of product; difference = protein-named minus other, per group; median of group differences for continuous outcomes, mean for percentages (bootstrap 95% CI over groups); Holm-adjusted Wilcoxon signed-rank P across all 24 C2 outcomes tested (21 shown). † Added sugars were reported for 46% of protein-named and 35% of other products.
| Outcome | Protein-named | Same category, other | C1 within-category difference (95% CI) | C2 brand-line difference (95% CI) | C2 groups | C2 Holm P |
|---|---|---|---|---|---|---|
| Protein, g/100 g | 25.6 | 6.50 | 22.9 (22.3 to 23.4) | 6.25 (5.00 to 7.14) | 594 | <0.001 |
| Protein, % of energy | 33.3 | 7.22 | 27.2 (26.6 to 27.8) | 10.2 (9.12 to 11.4) | 594 | <0.001 |
| Energy, kcal/100 g | 380.0 | 381.0 | 46.1 (35.8 to 48.4) | 2.0 (0.0 to 5.3) | 594 | 0.147 |
| Added sugars, g/100 kcal† | 1.44 | 6.25 | -3.61 (-3.86 to -3.28) | -0.47 (-0.65 to -0.08) | 290 | <0.001 |
| Total sugars, g/100 kcal | 2.22 | 6.23 | -3.76 (-3.96 to -3.48) | -0.55 (-0.75 to -0.40) | 585 | <0.001 |
| Sodium, mg/100 kcal | 95.7 | 66.7 | 34.3 (31.6 to 36.8) | 5.3 (2.7 to 9.4) | 590 | <0.001 |
| Saturated fat, g/100 kcal | 1.00 | 1.25 | 0.13 (0.10 to 0.17) | 0.01 (0.00 to 0.08) | 571 | <0.001 |
| Fibre, g/100 kcal | 1.55 | 0.63 | 0.54 (0.45 to 0.62) | 0.00 (0.00 to 0.06) | 573 | 0.014 |
| Energy per 10 g protein, kcal | 120.0 | 433.0 | -259.0 (-266.7 to -246.7) | -97.4 (-113.1 to -74.8) | 563 | <0.001 |
| Added sugars per 10 g protein, g† | 1.79 | 25.0 | -18.3 (-19.1 to -17.5) | -4.45 (-6.50 to -3.08) | 276 | <0.001 |
| Sodium per 10 g protein, mg | 116.6 | 300.1 | -126.1 (-130.8 to -120.2) | -37.1 (-50.4 to -25.2) | 562 | <0.001 |
| Ingredients, n | 14.0 | 8.00 | 0.36 (-0.29 to 0.86) | 1.00 (0.00 to 1.00) | 593 | <0.001 |
| Marker classes, n of 9 | 4.00 | 2.00 | 1.07 (0.99 to 1.33) | 0.50 (0.00 to 1.00) | 593 | <0.001 |
| Marker classes excluding protein isolates, n of 8 | 3.00 | 2.00 | 0.76 (0.72 to 1.02) | 0.00 (0.00 to 0.00) | 593 | <0.001 |
| Protein isolate, concentrate or hydrolysate, % | 86.9 | 10.5 | 54.4 (53.0 to 55.9) | 42.7 (38.7 to 46.7) | 593 | <0.001 |
| Non-sugar sweetener or polyol, % | 58.4 | 7.66 | 33.3 (31.6 to 34.8) | 7.95 (5.38 to 10.5) | 593 | <0.001 |
| Flavouring, % | 85.8 | 58.4 | 16.7 (15.5 to 18.0) | 6.79 (3.99 to 9.45) | 593 | <0.001 |
| Emulsifier, % | 58.4 | 30.0 | 13.6 (11.9 to 15.4) | 5.77 (3.20 to 8.64) | 593 | 0.003 |
| Thickener or gum, % | 44.2 | 29.3 | 6.27 (4.69 to 7.89) | 5.15 (2.17 to 8.31) | 593 | 0.019 |
| Sugar- or fibre-type substance, % | 48.9 | 30.7 | 4.24 (2.49 to 6.04) | 2.06 (-0.69 to 4.95) | 593 | 0.593 |
| Collagen or gelatin, % | 8.74 | 5.62 | 2.89 (1.89 to 3.85) | -0.25 (-1.91 to 1.44) | 593 | 0.147 |

3.4 Same brand, with and without “protein”
The 594 twin groups came from 358 brand owners and contained 3,152 protein-named products and 13,939 others (Table 2, C2 column). Within a brand line, the protein-named product had a median of 6.25 g more protein per 100 g (5.00–7.14) and 10.2 more percentage points of energy from protein. Energy per 100 g did not differ (2.0 kcal, 0.0–5.3; Holm P = 0.147). Added sugars per 100 kcal were lower by a median 0.47 g (−0.65 to −0.08; 290 groups) and sodium per 100 kcal higher by 5.3 mg (2.7–9.4). Protein isolates were 42.7 percentage points more common on average (38.7–46.7) and non-sugar sweeteners 8.0 points more common (5.4–10.5); the median group had no difference in additive classes once isolates were excluded. In short, the brand-line contrasts point the same way as the category contrasts but are several times smaller, which suggests that much of the category difference reflects which kinds of brands and products carry protein names rather than reformulation of a given product.
3.5 Sensitivity analyses
Restricting to products made available from 2023, when added-sugar reporting was more complete (61.6% of protein-named and 61.0% of other products), the within-category difference in added sugars per 100 kcal was −3.43 g (−3.81 to −2.85) and in sodium 35.9 mg (32.6–39.6). Stratifying by within-category energy-density quintile gave −3.53 g (−4.42 to −3.19) for added sugars, 38.5 mg (32.4–42.0) for sodium, 1.36 additive classes (1.17–1.43) and 32.5 percentage points (30.9–34.1) for non-sugar sweeteners. Claim-worded products alone gave −3.76 g (−4.17 to −3.08) for added sugars, 38.9 mg (35.8–44.4) for sodium and 37.0 percentage points (34.5–39.7) for sweeteners. No conclusion changed.
3.6 What is the protein worth?
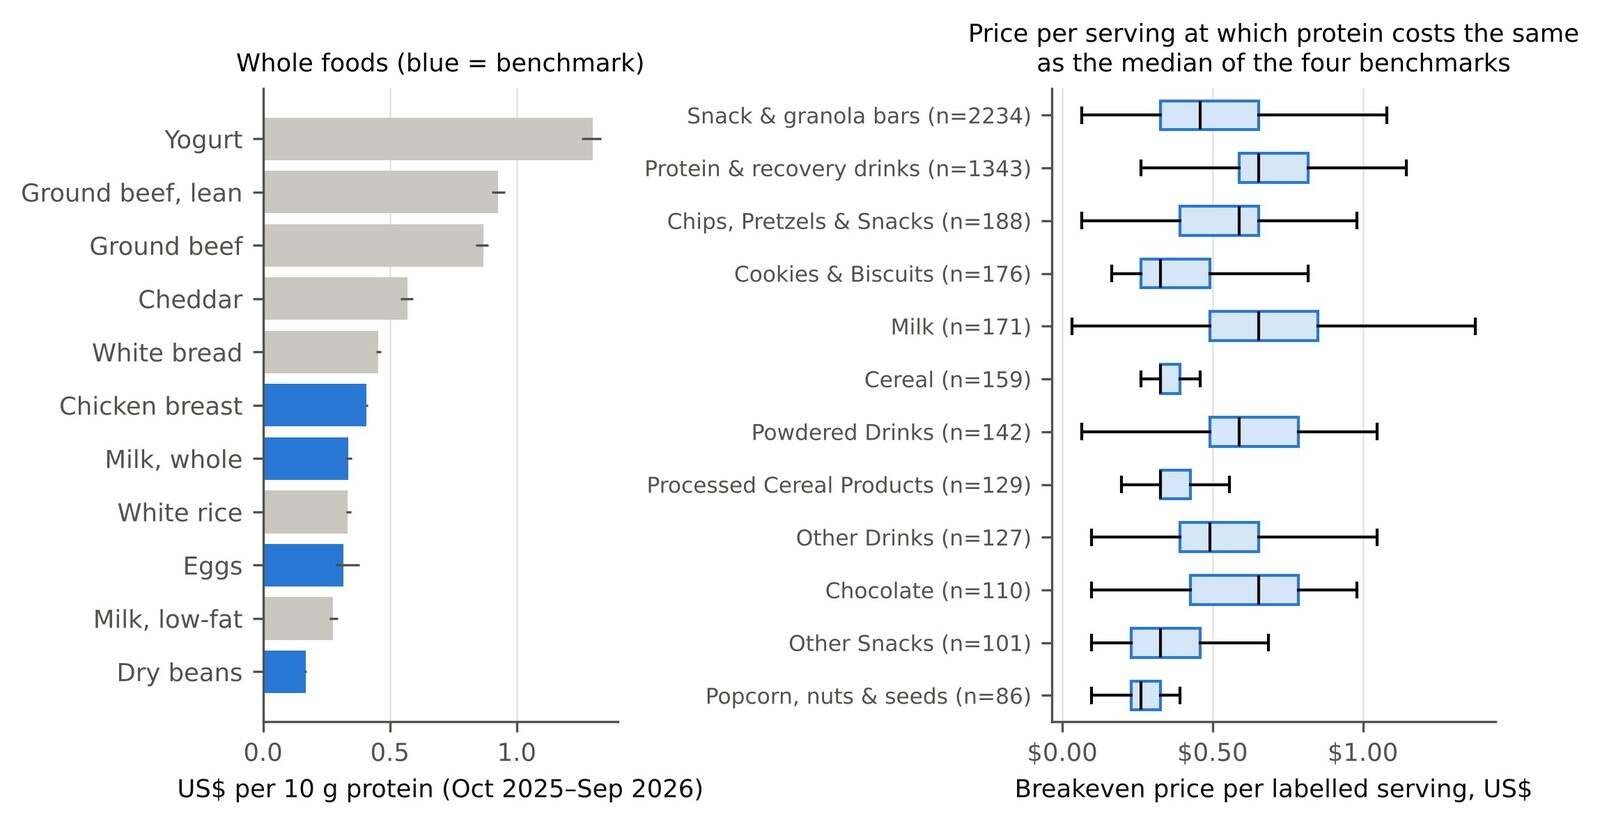
From October 2025 to September 2026, dried beans supplied 10 g of protein for US$0.169, eggs for US$0.317, whole milk for US$0.337 and boneless chicken breast for US$0.408 (Table 3, Figure 3A); the median of the four was US$0.327. Low-fat milk (US$0.275) and white rice (US$0.334) were in the same range; cheddar (US$0.569), ground beef (US$0.869 and US$0.926) and the BLS yogurt series (US$1.300) cost more per gram of protein. The egg price fell over the window, so its cost per 10 g ranged from US$0.284 to US$0.380.
At the median of the four benchmarks, the breakeven price of a protein-named product was US$0.49 per labelled serving (interquartile range 0.36–0.65; Table 4, Figure 3B). Against eggs alone it was US$0.48, against whole milk US$0.51, against chicken breast US$0.61 and against dried beans US$0.25. For protein bars the egg breakeven was US$0.44 per bar-sized serving (0.32–0.63), for a serving of a protein drink or shake (ready-to-drink or powder) US$0.63 (0.57–0.79), and for protein cereals and cookies US$0.32. Per package, the median breakeven against the four benchmarks was US$1.96 (0.65–5.89), for a median of 60 g of protein per package. These are thresholds. Whether a given product sells above or below them was not observed.
Within brand lines, the median protein-named product carried 1.66 times the protein per 100 g of the same brand’s other products (interquartile range 1.09–2.79; 561 groups with protein in the comparator); in 20.9% of groups the ratio was 1 or less. A protein-named product therefore remains the cheaper source of protein within its brand line as long as its price premium per 100 g is below r − 1. A 31% premium would be within that limit in 64.3% of groups, and a 50% premium in 56.0%. At a 50% premium the median group would still get 1.11 times as much protein per dollar from the protein-named version, and at 31%, 1.27 times. At the 132% mean premium reported in Germany, the protein-named product would remain the cheaper protein source in only 33.3% of groups, and the median group would get 0.71 times as much protein per dollar from it. Among categories with at least eight twin groups, the median ratio was highest for juice drinks, plant-based milk, other drinks and cake mixes (3.4 to 6.1) and lowest for meal replacements and other meats (1.0) and for frozen dinners and lunch combinations (1.2), where the comparator products were already high in protein.
Table 3. Whole-food cost of protein, US city average. Prices are the mean of the BLS Average Price series over October 2025 to September 2026 (no value was published for October 2025, so 11 months); composition from SR Legacy (SR item averaged where several are listed in the code). Range: lowest and highest monthly price. Bold rows are the four benchmarks used for breakeven prices; their median is US$0.327 per 10 g protein.
| Food (BLS series) | Mean price, US$ per unit | Protein, g/100 g | US$ per 10 g protein (range) | US$ per 100 kcal |
|---|---|---|---|---|
| Beans, dried (APU0000714233) | 1.68 per lb | 21.95 | 0.169 (0.163–0.171) | 0.109 |
| Milk, low-fat, reduced-fat or skim (APU0000FJ1101) | 3.55 per gallon | 3.30 | 0.275 (0.262–0.295) | 0.182 |
| Eggs, grade A large (APU0000708111) | 2.39 per dozen | 12.56 | 0.317 (0.284–0.380) | 0.279 |
| Rice, white, long grain, uncooked (APU0000701312) | 1.08 per lb | 7.13 | 0.334 (0.327–0.346) | 0.065 |
| Milk, whole (APU0000709112) | 4.14 per gallon | 3.15 | 0.337 (0.325–0.351) | 0.174 |
| Chicken breast, boneless (APU0000FF1101) | 4.17 per lb | 22.50 | 0.408 (0.406–0.412) | 0.765 |
| Bread, white pan (APU0000702111) | 1.83 per lb | 8.85 | 0.455 (0.446–0.466) | 0.152 |
| Cheddar cheese (APU0000710212) | 5.90 per lb | 22.87 | 0.569 (0.543–0.591) | 0.323 |
| Ground beef, 100% beef (APU0000703112) | 6.77 per lb | 17.17 | 0.869 (0.840–0.889) | 0.588 |
| Ground beef, lean and extra lean (APU0000703113) | 8.40 per lb | 20.00 | 0.926 (0.903–0.954) | 1.053 |
| Yogurt (APU0000FJ4101) | 1.55 per 8 oz | 5.25 | 1.300 (1.257–1.332) | 1.083 |
Table 4. Breakeven prices for protein-named products: the price at which the product would supply protein as cheaply as each whole-food benchmark (Table 3). Per serving: label protein per labelled serving × benchmark cost per gram. Per package: protein per 100 g × parsed package weight × benchmark cost per gram, against the median of the four benchmarks; package weight in FDC may refer to a single unit or a multipack, so per-package values are less reliable. Medians (interquartile range) in US$. Categories shown are the 14 with the most protein-named products that have a parsed package weight. These are thresholds, not observed prices.
| Category | Products with serving size (with package weight) | Protein per serving, g | Eggs | Whole milk | Dry beans | Chicken breast | Per package, median of four |
|---|---|---|---|---|---|---|---|
| Snack, Energy & Granola Bars | 2,234 (2,199) | 14 (10–20) | 0.44 (0.32–0.63) | 0.47 (0.34–0.67) | 0.24 (0.17–0.34) | 0.57 (0.41–0.82) | 1.64 (0.59–3.93) |
| Energy, Protein & Muscle Recovery Drinks | 1,343 (1,297) | 20 (18–25) | 0.63 (0.57–0.79) | 0.67 (0.61–0.84) | 0.34 (0.30–0.42) | 0.82 (0.73–1.02) | 6.90 (1.05–14.52) |
| Chips, Pretzels & Snacks | 188 (178) | 18 (12–20) | 0.57 (0.38–0.63) | 0.61 (0.40–0.67) | 0.30 (0.20–0.34) | 0.73 (0.49–0.82) | 1.37 (0.62–4.97) |
| Cookies & Biscuits | 176 (177) | 10 (8–15) | 0.32 (0.25–0.48) | 0.34 (0.27–0.51) | 0.17 (0.13–0.25) | 0.41 (0.33–0.61) | 1.30 (0.49–3.14) |
| Milk | 171 (170) | 20 (15–26) | 0.63 (0.48–0.83) | 0.67 (0.51–0.88) | 0.34 (0.25–0.44) | 0.82 (0.61–1.06) | 1.37 (0.65–4.05) |
| Cereal | 159 (147) | 10 (10–12) | 0.32 (0.32–0.38) | 0.34 (0.34–0.40) | 0.17 (0.17–0.20) | 0.41 (0.41–0.49) | 1.96 (0.96–2.85) |
| Powdered Drinks | 142 (138) | 18 (15–24) | 0.57 (0.48–0.76) | 0.61 (0.51–0.81) | 0.30 (0.25–0.40) | 0.73 (0.61–0.98) | 5.50 (0.97–10.18) |
| Other Drinks | 127 (122) | 15 (12–20) | 0.48 (0.38–0.63) | 0.51 (0.40–0.67) | 0.25 (0.20–0.34) | 0.61 (0.49–0.82) | 0.55 (0.39–0.98) |
| Processed Cereal Products | 129 (117) | 10 (10–13) | 0.32 (0.32–0.41) | 0.34 (0.34–0.44) | 0.17 (0.17–0.22) | 0.41 (0.41–0.53) | 1.64 (0.37–3.01) |
| Chocolate | 110 (107) | 20 (13–24) | 0.63 (0.41–0.76) | 0.67 (0.44–0.81) | 0.34 (0.22–0.40) | 0.82 (0.53–0.98) | 2.75 (0.49–16.46) |
| Other Snacks | 101 (95) | 10 (7–14) | 0.32 (0.22–0.44) | 0.34 (0.24–0.47) | 0.17 (0.12–0.24) | 0.41 (0.29–0.57) | 0.98 (0.41–1.40) |
| Popcorn, Peanuts, Seeds & Related Snacks | 86 (78) | 8 (7–10) | 0.25 (0.22–0.32) | 0.27 (0.24–0.34) | 0.13 (0.12–0.17) | 0.33 (0.29–0.41) | 1.21 (0.39–1.94) |
| Plant Based Milk | 77 (76) | 20 (10–23) | 0.63 (0.32–0.73) | 0.67 (0.34–0.77) | 0.34 (0.17–0.39) | 0.82 (0.41–0.94) | 1.49 (0.74–2.62) |
| Cake, Cookie & Cupcake Mixes | 72 (70) | 12 (10–15) | 0.38 (0.32–0.48) | 0.40 (0.34–0.51) | 0.20 (0.17–0.25) | 0.49 (0.41–0.61) | 3.73 (2.43–5.21) |
| All protein-named products | 5,914 (5,704) | 15 (11–20) | 0.48 (0.35–0.63) | 0.51 (0.37–0.67) | 0.25 (0.19–0.34) | 0.61 (0.45–0.82) | 1.96 (0.65–5.89) |
3.7 Observed prices: GroceryDB, 2021
GroceryDB listed 616 items with “protein” in the name and usable protein, price and weight fields; 334 passed the weight check. Their median observed cost was US$1.32 per 10 g of protein (interquartile range 0.77–2.05), about four times the benchmark median. Of these items, 94.9% cost more per gram of protein than the median of the four benchmarks, 95.2% more than eggs, 94.9% more than whole milk, 93.7% more than chicken breast and 97.9% more than dried beans; in breakeven terms, they were priced above their thresholds. Protein bars (137 items) had a median of US$1.69 per 10 g of protein and shakes (52 items) US$1.72; protein cereals (14 items, US$0.56) and pastas (8 items, US$0.51) were the least expensive groups. In the same stores and year, plain eggs (32 items) supplied 10 g of protein for a median US$0.43 and plain boneless chicken breast (15 items) for US$0.40. Protein-named items were cheaper at Walmart (median US$0.70, 85 items) than at Target (US$1.28, 92 items) and Whole Foods (US$1.74, 157 items). Without the weight check, the median was US$1.17 (616 items) and 97.1% exceeded the benchmark median.
4. Discussion
4.1 What the label marks
In this census of US label data, “protein” in a product’s name was a reliable marker of protein. Almost nine in ten protein-named products declared at least 10 g per serving, and within the same brand they carried about two-thirds more protein per 100 g than the brand’s other products. This agrees with the 10-product Irish basket in a news report, where most protein versions cost less per gram of protein (Flynn, 2026), and it is a reason to treat the US “protein premium” as a question about yardsticks: per 100 g, protein versions may well cost more, while per gram of protein they can cost less.
What comes with the protein is mixed. Protein-named products had less added sugar per calorie, which runs against the cereal case that motivated health-halo research (McKeon & Hallman, 2024), but they reached that point largely through non-sugar sweeteners and polyols, present in well over half of them. They had more sodium per calorie. These results confirm, in US label data, the pattern found in Germany (less sugar, more salt, more additives and sweeteners; Koop et al., 2024) and in Spain (more products high in sodium among those with protein claims; Beltrá et al., 2024); they are a replication across markets rather than a new finding. They contained more additive classes, partly by definition, because isolated proteins are themselves an industrial ingredient, and partly through flavourings and emulsifiers. Whether these differences matter for health is outside what this study can show. The markers count classes, not amounts, and are not a validated processing score.
4.2 What the protein is worth
The breakeven prices are low. A serving of a typical protein bar would need to cost under about 44 cents, and a serving of a protein drink or shake (ready-to-drink or powder) under about 63 cents, to supply protein as cheaply as eggs did in 2025–2026; against dried beans the thresholds halve. I did not observe current shelf prices for the products in FoodData Central. The 2021 GroceryDB prices, however, put almost all protein-named items well above the thresholds, at about four times the benchmark cost per gram of protein, and above plain eggs and chicken sold in the same stores; Walmart’s items came closest. The thresholds are robust to the choice among eggs, milk and chicken, which differ by about 30%. They agree with earlier findings that dairy, eggs, beans and pulses are among the cheapest sources of protein in the US (Drewnowski, 2025; Drewnowski & Conrad, 2024).
For public-health communication the two halves fit together. The protein label usually tells the truth about protein, so the case against these products is not deception about the headline nutrient. It is that the protein is expensive relative to staples, and that it often arrives with sweeteners, more sodium and a longer additive list. Many protein-rich products, notably yogurts and frozen meals, carry no protein name at all, so the name is a poor guide for a shopper who wants protein.
4.3 Limitations
The exposure is the product name, not the front of the package. FoodData Central records no claims, and phrases such as “good source of protein” almost never appear in the name, so many products with front-of-pack protein claims are counted as comparators. This biases category and brand-line differences towards zero if claim-bearing comparators resemble protein-named products. Precision of the name rule was high, but recall against actual claims cannot be measured from open data. The validation coding was done by an AI assistant with one rule and reviewed by the author, not by two independent human coders.
FoodData Central Branded Foods is a voluntary collection of label data gathered through a public-private partnership. It describes the product universe, not what is bought; records are not sales-weighted, many products may no longer be on sale despite lacking a discontinued date, and category assignment mixes two schemes. Powders (reported per 100 g) and ready-to-drink products (per 100 ml) share some categories, which inflates per-100 g contrasts such as protein per 100 g; the per-100 kcal and per-10 g-protein outcomes do not depend on dilution. Nutrient values per 100 g are derived from rounded label values, which matters most for small servings. Added sugars were missing for most older records; the post-2023 sensitivity analysis gave similar results, but missingness is not random. The protein-per-serving tiers use labelled servings and uncorrected protein, so they overstate eligibility for claims, especially for collagen-based products and others with low protein quality. Ingredient markers rely on regular expressions and may misclassify unusual wording.
Prices are national averages for a handful of staples and include no store-brand, regional or package-size variation. Edible yields and raw composition ignore cooking losses, and protein quality was not corrected, which favours beans relative to animal foods. The 31%, 50% and 132% premiums come from non-US sources (a news report, a consumer organisation and a German study) and are used only as scenarios. The GroceryDB check uses 2021 prices from three retailers, a weight filter that drops almost half of the items, and items that cannot be matched to the FoodData Central products. Package weights were parsed from free text and may describe multipacks. Finally, brand-line twins share a brand but not necessarily a product form; a brand’s protein bar may be compared with its granola bar.
5. Conclusion
In USDA’s April 2026 Branded Foods release, US packaged foods with “protein” in their name nearly always carried substantial protein, with less added sugar but more sodium per calorie, more sweeteners and more additive classes than comparable products. Their protein is good value only at low prices. For the median protein-named product (15 g of protein per serving), eggs and dried beans supply the same protein more cheaply at any price above about 49 cents a serving, and all four staples do above about 61 cents; observed 2021 prices put almost all protein-named products above these thresholds. Most products high in protein do not say so in their name.
Related on x9m8
- Eating less, eating differently: the cost of an adequate diet on GLP-1 drugs, paper 10
- Eating less of the same: modelled nutrient gaps on GLP-1 drugs, paper 9
- Food swamps and obesity revisited: a reproduction with public data
Acknowledgements
The author thanks the USDA Agricultural Research Service for FoodData Central and the Bureau of Labor Statistics for its average price series. Claude (Anthropic; model claude-opus-5-5) assisted with data retrieval, analysis code, validation coding, literature search and drafting in October 2026, as described in §2.6. The author reviewed all outputs and is responsible for the content.
Author contributions
P.K. conceived the study, directed the analysis, and reviewed and approved the manuscript.
Financial support
This research received no specific grant from any funding agency, commercial or not-for-profit sector.
Conflicts of interest
The author operates a restaurant, The Heritage Diner, in Mount Sinai, New York, which buys and serves foods of the kinds discussed here (including eggs, milk and chicken). He declares no financial interest in packaged-food, supplement or protein-product companies.
Research transparency and reproducibility
All data are public. FoodData Central data are in the public domain under CC0 1.0 Universal; BLS average price data are in the public domain; GroceryDB is released under the MIT licence. Code, derived extracts and result files are in the reproducibility package linked from the article page, with a README giving source URLs and run order. The full FoodData Central zip and the GroceryDB file are not redistributed; they can be downloaded from https://fdc.nal.usda.gov/download-datasets and https://github.com/Barabasi-Lab/GroceryDB. The analysis was not preregistered.
References
Beltrá, M., Borrás, F., & Ropero, A. B. (2024). Are foods with protein claims healthy? A study of the Spanish market. Nutrients, 16(24), 4281. https://doi.org/10.3390/nu16244281
Drewnowski, A. (2010). The cost of US foods as related to their nutritive value. The American Journal of Clinical Nutrition, 92(5), 1181–1188. https://doi.org/10.3945/ajcn.2010.29300
Drewnowski, A. (2025). Perspective: Milk and dairy provide affordable high-quality protein and merit inclusion in the protein foods group. Current Developments in Nutrition, 9(1), 104539. https://doi.org/10.1016/j.cdnut.2024.104539
Drewnowski, A., & Conrad, Z. (2024). Pulse crops: Nutrient density, affordability, and environmental impact. Frontiers in Nutrition, 11, 1438369. https://doi.org/10.3389/fnut.2024.1438369
Flynn, V. (2026, September 29). The protein premium: How much extra do we pay, and how stupid are we to pay it? The Journal (TheJournal.ie). https://www.thejournal.ie/high-protein-food-prices-7176630-Sep2026/
Food labeling: Nutrition labeling of food, 21 C.F.R. § 101.9 (2026).
Kaur, A., Scarborough, P., & Rayner, M. (2017). A systematic review, and meta-analyses, of the impact of health-related claims on dietary choices. International Journal of Behavioral Nutrition and Physical Activity, 14(1), 93. https://doi.org/10.1186/s12966-017-0548-1
Koop, J., Fedde, S., Hägele, F. A., Beunink, C., Müller, M. J., & Bosy-Westphal, A. (2024). Nutritional value and environmental aspects of high-protein ultra-processed foods on the German market. Public Health Nutrition, 27(1), e211. https://doi.org/10.1017/S1368980024001836
Lee, H. R., Cho, I., Yi, H., & Park, H. J. (2024). High-protein products in 2013 and 2023: Shifts in diverse aspects over the last ten years. Food Supplements and Biomaterials for Health, 4(2), e9. https://doi.org/10.52361/fsbh.2024.4.e9
McKeon, G., & Hallman, W. (2019). Characterization and comparative analysis of foods with front-of-package protein claims (P04-149-19). Current Developments in Nutrition, 3(Suppl. 1), nzz051.P04-149-19. https://doi.org/10.1093/cdn/nzz051.P04-149-19
McKeon, G. P., & Hallman, W. K. (2024). Front-of-package protein labels on cereal create health halos. Foods, 13(8), 1139. https://doi.org/10.3390/foods13081139
Monteiro, C. A., Cannon, G., Levy, R. B., Moubarac, J.-C., Louzada, M. L. C., Rauber, F., Khandpur, N., Cediel, G., Neri, D., Martinez-Steele, E., Baraldi, L. G., & Jaime, P. C. (2019). Ultra-processed foods: What they are and how to identify them. Public Health Nutrition, 22(5), 936–941. https://doi.org/10.1017/S1368980018003762
Nutrient content claims for “good source,” “high,” “more,” and “high potency,” 21 C.F.R. § 101.54 (2026).
Rafferty, M. (2026, September 8). How much is the protein premium costing you? CHOICE. https://www.choice.com.au/food-and-drink/nutrition/food-labelling/articles/how-much-is-the-protein-premium-costing-you
Ravandi, B., Ispirova, G., Sebek, M., Mehler, P., Barabási, A.-L., & Menichetti, G. (2025). Prevalence of processed foods in major US grocery stores. Nature Food, 6(3), 296–308. https://doi.org/10.1038/s43016-024-01095-7
Taillie, L. S., Ng, S. W., Xue, Y., Busey, E., & Harding, M. (2017). No fat, no sugar, no salt . . . no problem? Prevalence of “low-content” nutrient claims and their associations with the nutritional profile of food and beverage purchases in the United States. Journal of the Academy of Nutrition and Dietetics, 117(9), 1366–1374.e6. https://doi.org/10.1016/j.jand.2017.01.011
US Bureau of Labor Statistics. (2026). Consumer Price Index: Average price data, U.S. city average (series AP) [Data set]. Retrieved October 22, 2026, from https://download.bls.gov/pub/time.series/ap/
US Department of Agriculture, Agricultural Research Service. (2018). FoodData Central: SR Legacy (April 2018 release) [Data set]. https://fdc.nal.usda.gov/
US Department of Agriculture, Agricultural Research Service. (2026). FoodData Central: Branded Foods (April 30, 2026 release) [Data set]. Retrieved October 22, 2026, from https://fdc.nal.usda.gov/download-datasets
Zhou, P., Zheng, Y., Kaiser, H. M., & Gómez, M. I. (2026). On-package claims are imperfect signals of overall nutritional quality. Nature Food, 7(10), 1011–1020. https://doi.org/10.1038/s43016-026-01435-9




[…] Paying for protein: protein-named US packaged foods, nutrients and breakeven prices […]