






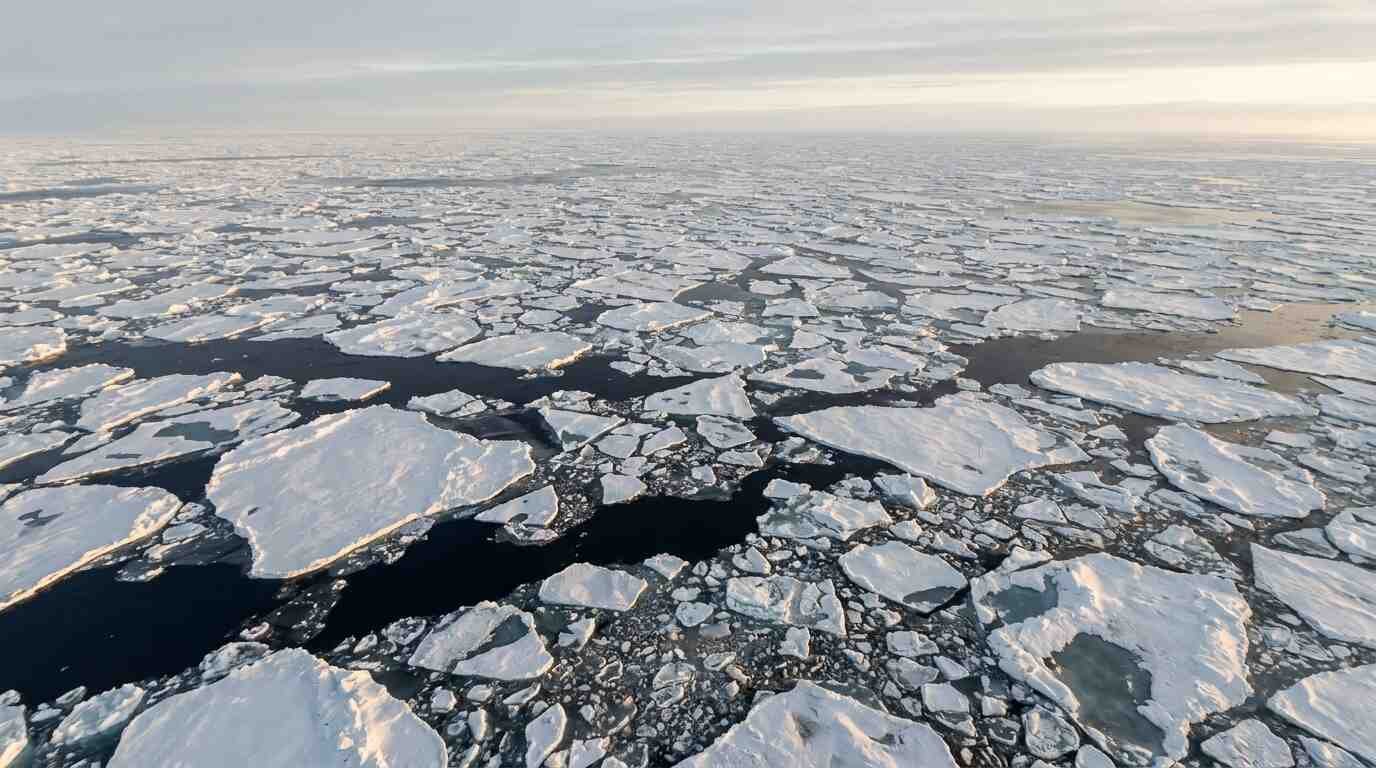
The 2026 Arctic sea ice minimum was 4.6 million km2 by NASA's count, yet agencies rank it 10th, 11th or 14th. Here is why, and what it means.
The 2026 Arctic sea ice minimum arrived on September 12, when the floating ice cap shrank to about 4.6 million square kilometers (1.78 million square miles), according to NASA and the National Snow and Ice Data Center. Depending on whose dataset you open, that makes this year the 10th, 11th or 14th lowest since satellites started counting in 1978 and 1979.
That spread is not a scandal. It is a useful look at how a number that sounds exact is built from microwave brightness measured from orbit, and at how little separates one recent summer from the next. This post goes through the figures, the reasons the agencies disagree, why the September minimum has stopped falling as fast as it did, and what the thin, young ice that is left tells you that the headline number does not.
What happened on September 12
Arctic sea ice follows a yearly cycle. It grows through the dark months, usually peaking in March, and then retreats through spring and summer until it bottoms out in September. The 2026 low came on September 12, per NASA and NSIDC, at roughly 4.6 million km². NASA says that ties 2008, 2010 and 2025 for the 10th-lowest minimum in the satellite record.
Two context points matter more than the rank. First, the 20 lowest September minimums on record are, without exception, the 20 summers from 2007 through 2026. Second, the March 2026 maximum statistically tied 2025 for the lowest winter maximum ever recorded, so the ice started the melt season from a low base. The record low remains September 2012.
Everything here comes from the agencies’ published summaries. NSIDC’s own post could not be retrieved while I was researching this, so the NSIDC ranking below is as reported by the UK Met Office, not read directly.
Why three agencies give three ranks
NASA reports a tie for 10th. The UK Met Office, using the OSI SAF Sea Ice Index, puts 2026 at 14th lowest with a minimum of 5.06 million km² on the same date. The Met Office footnote says the NSIDC Sea Ice Index ranks it 11th lowest. So the same ice, on the same day, produces a gap of about 0.46 million km² between the NASA figure and the OSI SAF figure.
The Met Office attributes the disagreement to two things. Several recent years finished with minimums that are very close together, so a tiny shift reorders the table. And the minimum itself is sensitive to how the microwave data are converted into ice coverage. Each group uses its own algorithm and its own handling of mixed pixels, where open water, melt ponds and thin ice share one sensor footprint.
Treat the absolute extents as a family of estimates with a systematic offset between members, not as competing facts. Within one product the year-to-year comparison is consistent. Across products, only compare like with like. That is the practical rule if you plan to quote a ranking.
How a satellite measures ice through cloud
Sea ice is detected with passive microwave radiometers. Ice emits more microwave energy at the relevant frequencies than open water does, and microwaves pass through clouds and do not need sunlight, so the sensors work through the polar night and through overcast summers. NASA’s record starts with the Nimbus-7 satellite in October 1978, continues with Defense Meteorological Satellite Program instruments from 1987, and has passed through other sensors since, including the AMSR2 instrument on Japan’s GCOM-W satellite.
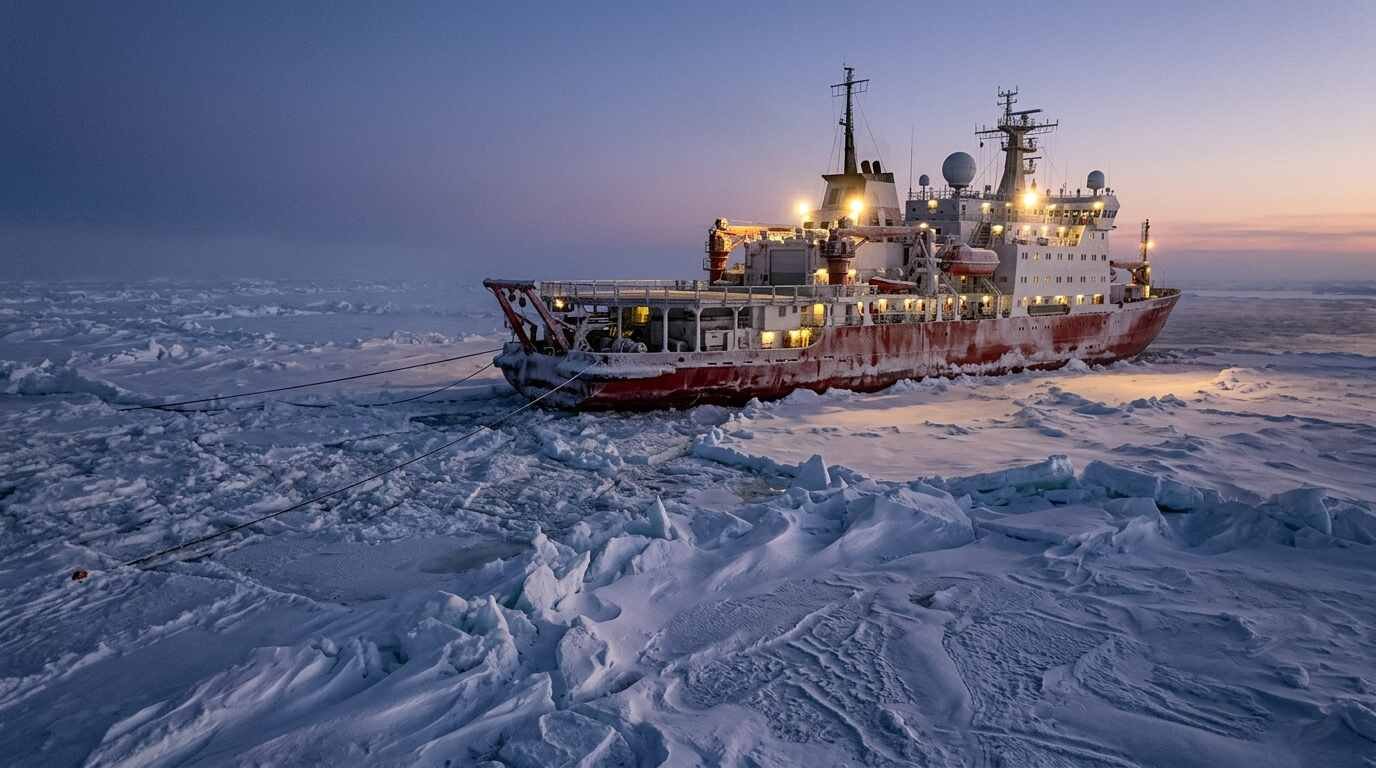
The catch is that the instruments see brightness, not ice. Software turns brightness into concentration, and a pixel is usually counted as ice-covered when concentration crosses a threshold. Meltwater on top of floes can mimic open water. The region directly around the pole is not observed at all, and NASA notes that its estimates assume this so-called pole hole is ice-filled.
Working through the numbers
Start with the Met Office data, which gives enough to reconstruct the baseline. The 2026 minimum of 5.06 million km² sits 1.51 million km² below the 1981-2010 average minimum, so that average is about 6.57 million km². Subtract again: the minimum is 0.75 million km² above the long-term linear trend, which implies the trend line predicted something near 4.31 million km² for this year. Those two derived values are my arithmetic from the published differences, not figures the Met Office states.
What does that tell you? Against the old baseline, 2026 lost roughly 23 percent of the average September ice cover in the OSI SAF data (1.51 divided by 6.57). Against the trend, it did a little better than expected. That fits a plateau: the decline is steep over the whole record, but this summer finished above where a straight line drawn through the 1979 to 2026 data would put it.
The NSIDC figure, 1.63 million km² below the 1981-2010 average, is about 0.12 million km² further below than OSI SAF’s 1.51. Small as that looks, in a crowded part of the ranking it is enough to move a year by several places.
Why the minimum has leveled off
NASA scientists say September extent has been relatively steady in recent years. Walt Meier of NSIDC put it this way in NASA’s account: “We’ve plateaued, but we’re still low relative to the earlier part of the record.” Linette Boisvert of NASA Goddard points to cloud cover, which has increased over the past decade and shielded the ice from sunlight that would otherwise have sped up melt.
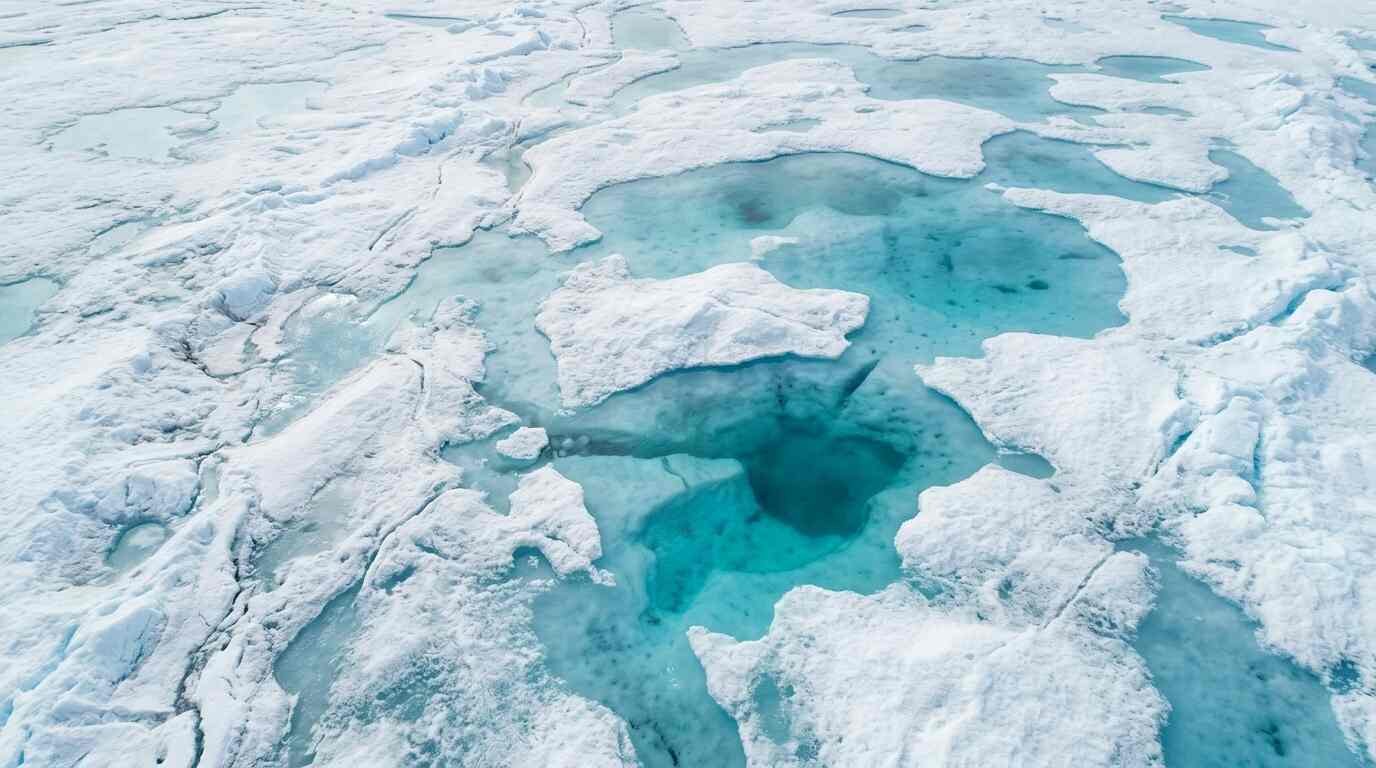
Weather also swings the result. A summer dominated by persistent high pressure and clear skies melts far more than one with cloud and storms, and winds can compact floes or push them toward warmer water. None of this is a reversal. NASA’s Earth Observatory is explicit that the decline cannot be explained by natural variability alone.
A plateau of about a decade is short compared with the climate signal. Internal variability, such as the Arctic Oscillation, can mask a trend for a decade or so. Whether the pause persists or whether the next big melt summer resets the record is not something these sources can tell us.
The ice that is left is younger and thinner
Extent counts area where ice concentration is above a threshold. It says nothing about thickness. NASA notes that multiyear ice, the thick floes that survive at least one melt season, continues to decline, so the pack is dominated by thinner first-year ice. First-year ice melts out more easily the following summer, so a given extent is more fragile than the same extent was in the 1980s.
That is why a flat September number is not the same as stability. The ice could stay near 4.6 million km² while its volume keeps changing. Neither the NASA nor the Met Office pages I read gave a 2026 thickness or volume figure, so I will not offer one.
The Antarctic side, briefly
The southern ice is on a different clock. Its maximum arrives in late September or early October. As of September 20, the Met Office reported a maximum to date of 18.12 million km² on September 11, which would rank third lowest in the satellite era behind 17.53 million km² in 2023 and 17.65 million km² in 2024, if it is not exceeded. It is provisional; maximums have occasionally been recorded as late as early October.
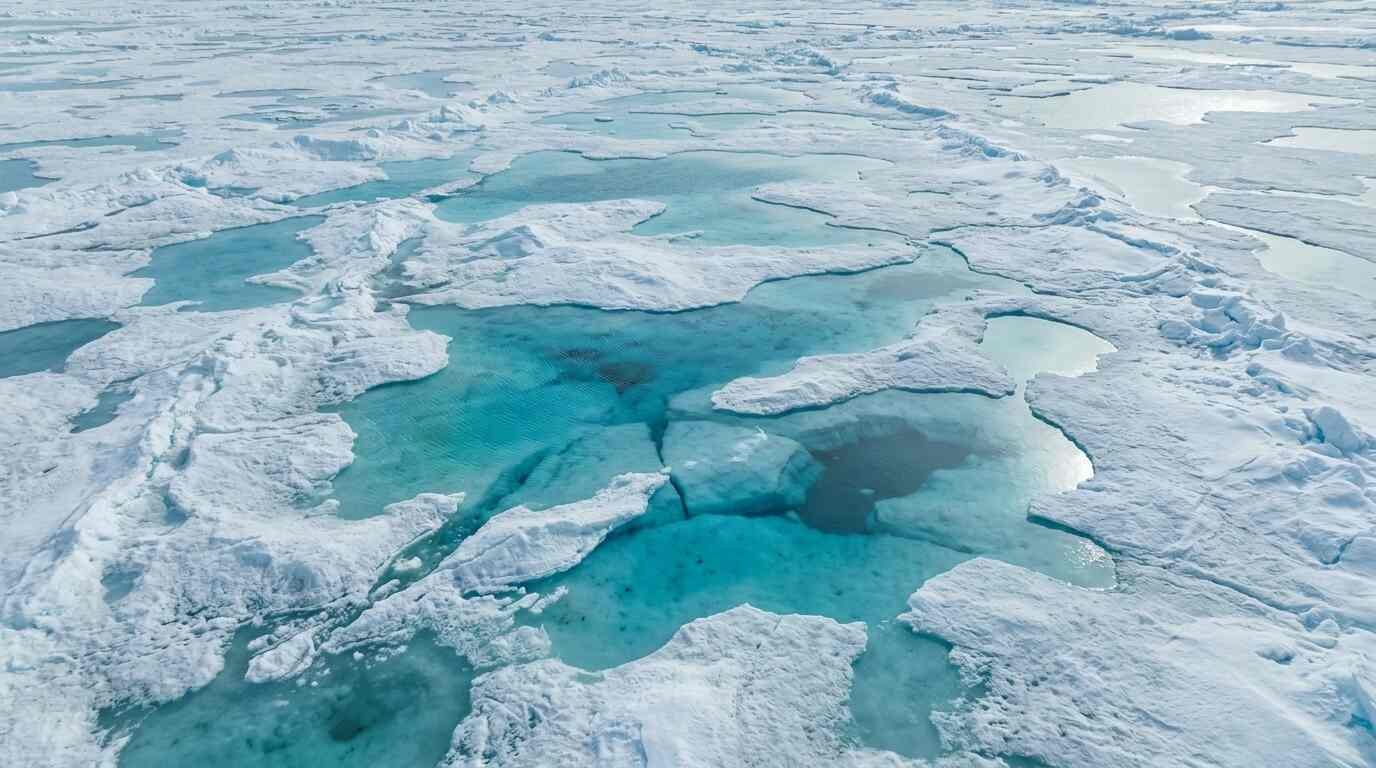
NASA’s account adds that Antarctic ice dropped by roughly 300,000 km² over six days in August before growth resumed. Meier attributed this to weather compacting thin, mobile ice at the outer edge, an event common in kind but unusual in size. Because Antarctic sea ice is not bounded by land to the north, it swings more from year to year, and both scientists are cautious about calling recent low maximums a lasting trend.
What to watch for next
The immediate thing is whether the Antarctic maximum gets revised upward once NASA and NSIDC publish their figure. After that, the autumn freeze-up speed in the Arctic and the March 2027 maximum will show whether the thin winter cover persists. The IPCC projection cited by NASA is that an essentially ice-free Arctic in September could occur at least once before mid-century. Nothing in 2026 changes that on its own.
Frequently asked questions
What was the Arctic sea ice minimum in 2026?
NASA and NSIDC put it at about 4.6 million square kilometers on September 12, 2026. The UK Met Office, using OSI SAF data, reports 5.06 million km² for the same date. The difference reflects different processing of the same satellite microwave data.
Is 2026 a record low for Arctic sea ice?
No. NASA ranks it tied for 10th lowest. The record low minimum was in September 2012. The March 2026 maximum, however, statistically tied 2025 for the lowest on record.
Why do agencies rank the same year differently?
Recent minimums are very close together, and the exact extent depends on the algorithm that turns microwave brightness into ice concentration. The Met Office lists 14th (OSI SAF) and 11th (NSIDC); NASA lists a tie for 10th.
Has Arctic sea ice stopped declining?
September extent has leveled off in recent years, per NASA and NSIDC scientists, but it remains low compared with earlier decades. The ice that remains is thinner and younger, and the 20 lowest minimums all fall between 2007 and 2026.
A ranking is a convenient way to talk about a summer, and a poor way to measure a climate. The better question this year is why a record that fell hard through the 2000s has been moving sideways, and the current answer, clouds and weather on top of an unchanged warming signal, is only partly tested. The thin first-year ice that dominates the pack today leaves little margin if the weather turns in a bad year. When you read next September’s headline, check which dataset it uses before you compare it to this one.
Sources