
Preprint, version 1 (November 2026). Not peer reviewed. This is the author’s manuscript, prepared for submission to a peer-reviewed journal. Download: PDF · Word · reproducibility package (zip) · code on GitHub (link added at publication) with code, results and the two independent audits.
Cite as: Kalafatis, P. (2026). Branching and Extinction in Patent Citation Lineages: Biotechnology versus Information Storage, 1963-1999 [Preprint]. x9m8.com.
Peter Kalafatis (ORCID: 0009-0000-1637-7142)
Independent researcher, x9m8.com, New York, NY, USA. Correspondence: x9m8x7@gmail.com
Version 1, November 2026.
Abstract
Patent citations are sometimes treated as a measurable analogue of descent: a citing patent builds on a cited one, and citation chains can be read as lineages. Using NBER/USPTO patent and citation data (Hall, Jaffe, & Trajtenberg, 2001), I build intra-class citation graphs for two contrasting USPC classes – Biotechnology (435, 800) and Information Storage (360, 365, 369, 711), patents granted 1963-1999, citations recorded 1975-1999 – and ask how fast lineages branch and how long they stay active before citation activity stops. The classes differ in both respects: Information Storage has a higher mean branching factor (3.96 vs. 2.12 direct citing descendants) and deeper maximum lineage (19 vs. 13 generations), while more Biotechnology patents are never cited within their own class (53.9% vs. 32.9%). Median time-to-last-citation is identical in both classes (9 years) among ever-cited patents, but the share of lineages still apparently active at the 1999 window edge is far higher for Information Storage (89.1%) than Biotechnology (72.7%), likely reflecting each field’s growth trajectory over this window rather than a true persistence difference. This is an applied case study using an established method, not a new one; findings are descriptive and exploratory, not a general claim about technology evolution.
Keywords: patent citations; technology evolution; citation networks; biotechnology; patent analysis
Social media summary: NBER/USPTO patent data show Information Storage citation lineages branch deeper and more often than Biotechnology ones, 1963-1999.
1. Introduction
A citation from one patent to an earlier one is often read informally as evidence that the later invention builds on the earlier one. Scaled up across a whole technology class, the resulting web of citations looks like a family tree: some early patents spawn many direct descendants and long chains of further citations, while others are cited once or never again. Hall, Jaffe, and Trajtenberg (2001) built the standard public data infrastructure for this kind of work, and a body of research since has used patent citation networks to trace the trajectory of a single technology’s development over time – Verspagen (2007), for instance, maps the history of fuel cell research as a citation network. The general technique – treating citation chains within a defined technology area as a proxy for intellectual descent, and studying the resulting graph’s branching and persistence – is not new, and I am not aware of any claim to originality in the method used here. What follows is a narrower, fully reproducible application of that existing approach to two specific, contrasting technology classes, using one specific, static, public dataset, with the code and provenance needed to check or repeat every number.
The research question is deliberately modest: within a given technology class, how quickly do citation lineages branch from early patents, and how long does a lineage keep attracting citations before it goes quiet? I compare two USPC classes chosen to contrast a fast-moving, largely-founded- within-the-data-window field (Biotechnology, USPC 435 and 800) against a more gradually evolving one (Information Storage, USPC 360, 365, 369, and 711), over the only window the underlying data covers: patents granted 1963-1999, with citation records existing only for citations made by patents granted 1975-1999.
2. Methods
2.1 Data
All data come from NBER’s public patent data file (Hall, Jaffe, & Trajtenberg, 2001), served with no login or API key required from data.nber.org: apat63_99.zip (one row per US utility patent granted 1963-1999, including grant year and the Hall-Jaffe-Trajtenberg six-category/36-subcategory technology classification already computed by NBER) and acite75_99.zip (citing/cited patent number pairs for all citations made by patents granted 1975-1999). The same underlying data (through a 2009 static snapshot) also underlies the Stanford SNAP “US Patent citation network” dataset (Leskovec, Kleinberg, & Faloutsos, 2005), which is the more commonly cited entry point to this graph in the network-science literature, though the present analysis uses NBER’s own files directly because they carry the technology classification needed to scope the analysis by class.
Two NBER subcategories were selected to give a fast-moving and a more established field: 33 “Biotechnology” (USPC classes 435, 800) and 24 “Information Storage” (USPC classes 360, 365, 369, 711). An intra-class citation graph was built separately for each subcategory, keeping only citation edges where both the citing and the cited patent are classified in that same subcategory (32,170 patents / 68,246 edges for Biotechnology; 51,460 patents / 203,974 edges for Information Storage). Edges that cross class boundaries are not part of either graph; this means the reported statistics describe citation activity within a class, not a patent’s total citation count.
2.2 Definitions
An edge (citing, cited) is read as “citing” building on “cited”: cited is the ancestor, citing is the direct descendant. A root is a patent with no in-class ancestor (it cites nothing else within its own class). A patent’s generation is 0 if it is a root, otherwise one more than the maximum generation of its in-class ancestors. A patent’s branching factor is its number of direct in-class citing descendants. A patent’s extinction age is the number of years between its own grant and the grant year of the most recent patent reachable by following citing edges forward from it (including itself); this is computed only for patents cited at least once within their class, and is right-censored (flagged, not discarded) whenever that most recent year is 1999, the last year the citation file covers – a lineage flagged this way may simply still be active beyond the data window, not actually extinct.
Computing generation and extinction age each require processing patents in a topological order of the intra-class citation graph (every ancestor before its descendants, or the reverse). Grant year alone does not give this: 163 edges in Biotechnology and 1,036 in Information Storage connect a citing and a cited patent granted in the same year (e.g., patent 3,929,580 (1975) citing 3,867,259 (1975)), with no ordering between them implied by year alone. This is resolved instead by patent number: patent numbers are assigned strictly sequentially at grant, and this was verified directly against both scoped graphs before relying on it – across all 272,220 intra-class edges in the two classes combined, the citing patent’s number is strictly greater than the cited patent’s number with zero exceptions. Patents are therefore processed in ascending (for generation) or descending (for extinction age) patent-number order, which gives an exact, tie-free topological order for this graph with no ambiguity left to resolve.
2.3 Computation and a deviation from this series’ usual pipeline
This paper’s analysis pipeline (filtering, graph construction, and all statistics) is implemented in a single documented JavaScript file, code/browser_pipeline.js. This is a deliberate departure from this series’ usual practice of downloading raw data to local disk and running a local Python pipeline, forced by the available computing environment: direct network access to data.nber.org (and to several alternative patent-data sources that were tried first) was not available from the machine used to draft this paper, and no channel was available to move the multi-hundred-megabyte raw source files onto that machine’s disk either. The pipeline was instead run inside a standard desktop browser with direct network access, which could fetch and fully process the complete source files in memory (zip decompression was done with the browser’s native DecompressionStream API over a hand-written ZIP reader, with no third-party code). Every number reported below comes from that pipeline run against the complete source files (2,923,922 patents and 16,522,438 citations recovered in total, consistent with NBER’s own description of the dataset – “almost 3 million” patents, “over 16 million” citations – though NBER’s page gives no exact digits to check against); a small, non-fabricated row-level sample (the first 150 patents and first 150 edges of each class, by file order) was separately exported for spot-checking and is included in data/raw/, but no reported statistic is derived from that sample – all of them come from the complete filtered graphs. Full detail, including the SHA-256 hashes of the exact source files used, is in results/provenance.md. A reader who can reach data.nber.org directly can reproduce every number here by running the committed Python scripts (code/load.py, analysis.py, figures.py, tables.py) against a local download of the same two files, or by running code/browser_pipeline.js as described in that file’s own header.
2.4 AI-use disclosure
Claude (Anthropic), accessed through Claude Code in 2026-11, was used to write the data-retrieval and analysis pipeline (code/browser_pipeline.js and the Python scripts in code/), to produce the figures and tables from the resulting aggregate data, and to draft this manuscript text. All code, figures, numbers, and literature citations were reviewed by the author, who takes full responsibility for the content of this paper.
3. Results
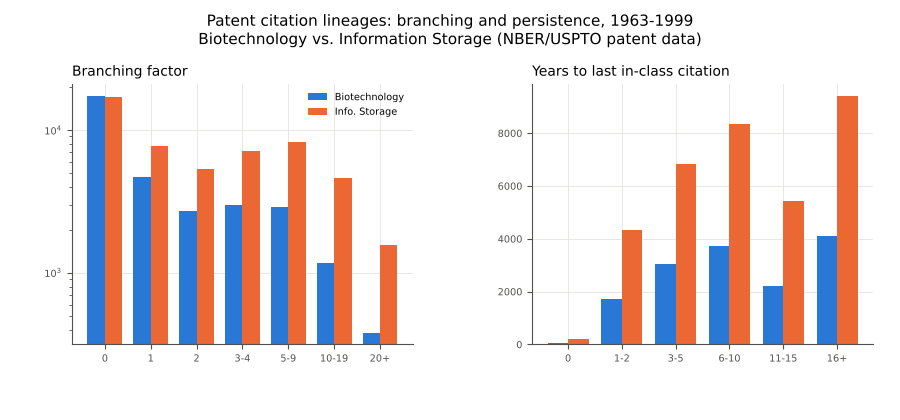
Table 1 (results/tables.md) summarizes both classes. Information Storage shows a higher mean branching factor (3.96 vs. 2.12 direct within-class citing descendants per patent) and a deeper maximum lineage (19 vs. 13 generations from a root), while a markedly larger share of Biotechnology patents are never cited within their own class at all (53.9% vs. 32.9%). Figure 2 shows the full branching-factor distribution for both classes: the pattern in each is strongly right-skewed, with a small number of patents accounting for most of the within-class citing activity. Patent 4,683,195 (“Process for amplifying, detecting, and/or-cloning nucleic acid sequences,” granted 1987) – Kary Mullis’s foundational PCR patent – has by far the largest within-class fan-out in Biotechnology (508 direct citing descendants), with its companion patent 4,683,202 (“Process for amplifying nucleic acid sequences,” also granted 1987) close behind (495); together they illustrate how concentrated branching can be around a single foundational method (Table 2).
Figure 1 shows one concrete example lineage: a Biotechnology root patent granted in 1963 whose citation descendants fan out across three decades into a 29-patent subgraph reaching as late as 1999, illustrating both branching and the long citation lags that are typical in this data.
On persistence, the two classes converge in their central tendency but diverge in their tails. Median extinction age among ever-cited patents is identical in both classes (9 years). However, Information Storage shows far more right-censoring: 89.1% of its ever-cited patents have a last in-class citation in 1999 itself (the window edge), against 72.7% for Biotechnology (Figure 3). Read plainly, this says that most lineages in both classes appear, within this dataset, to still be “active” when the window closes – which is at least partly an artifact of the two fields’ different growth trajectories within this period (see Limitations) rather than direct evidence that one field’s ideas persist longer than the other’s.
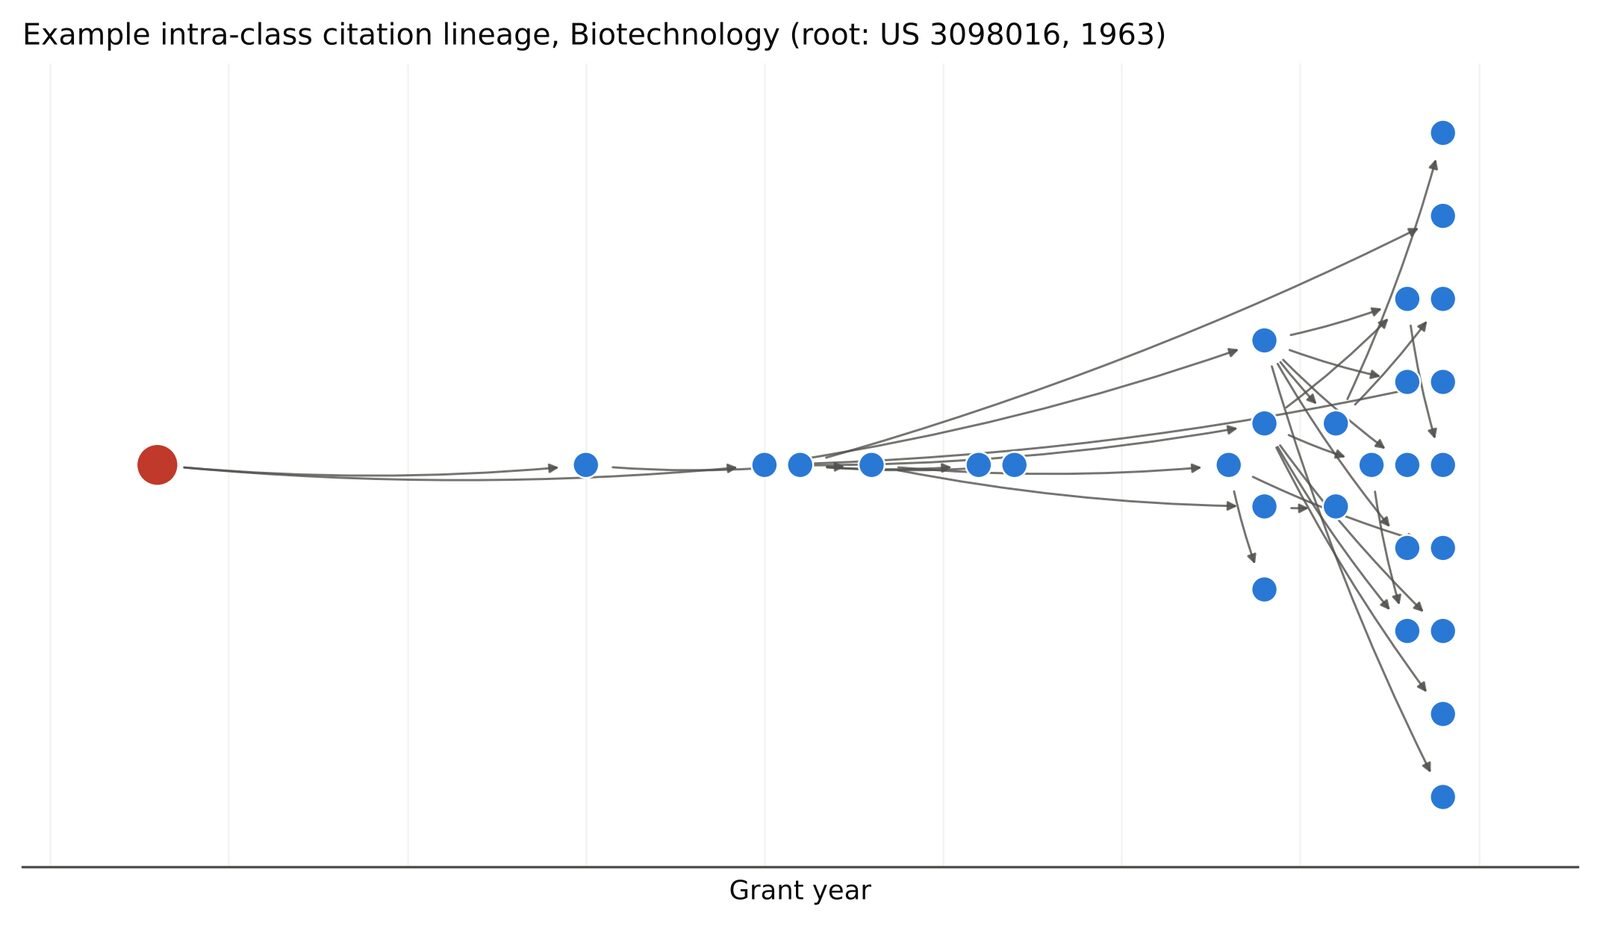
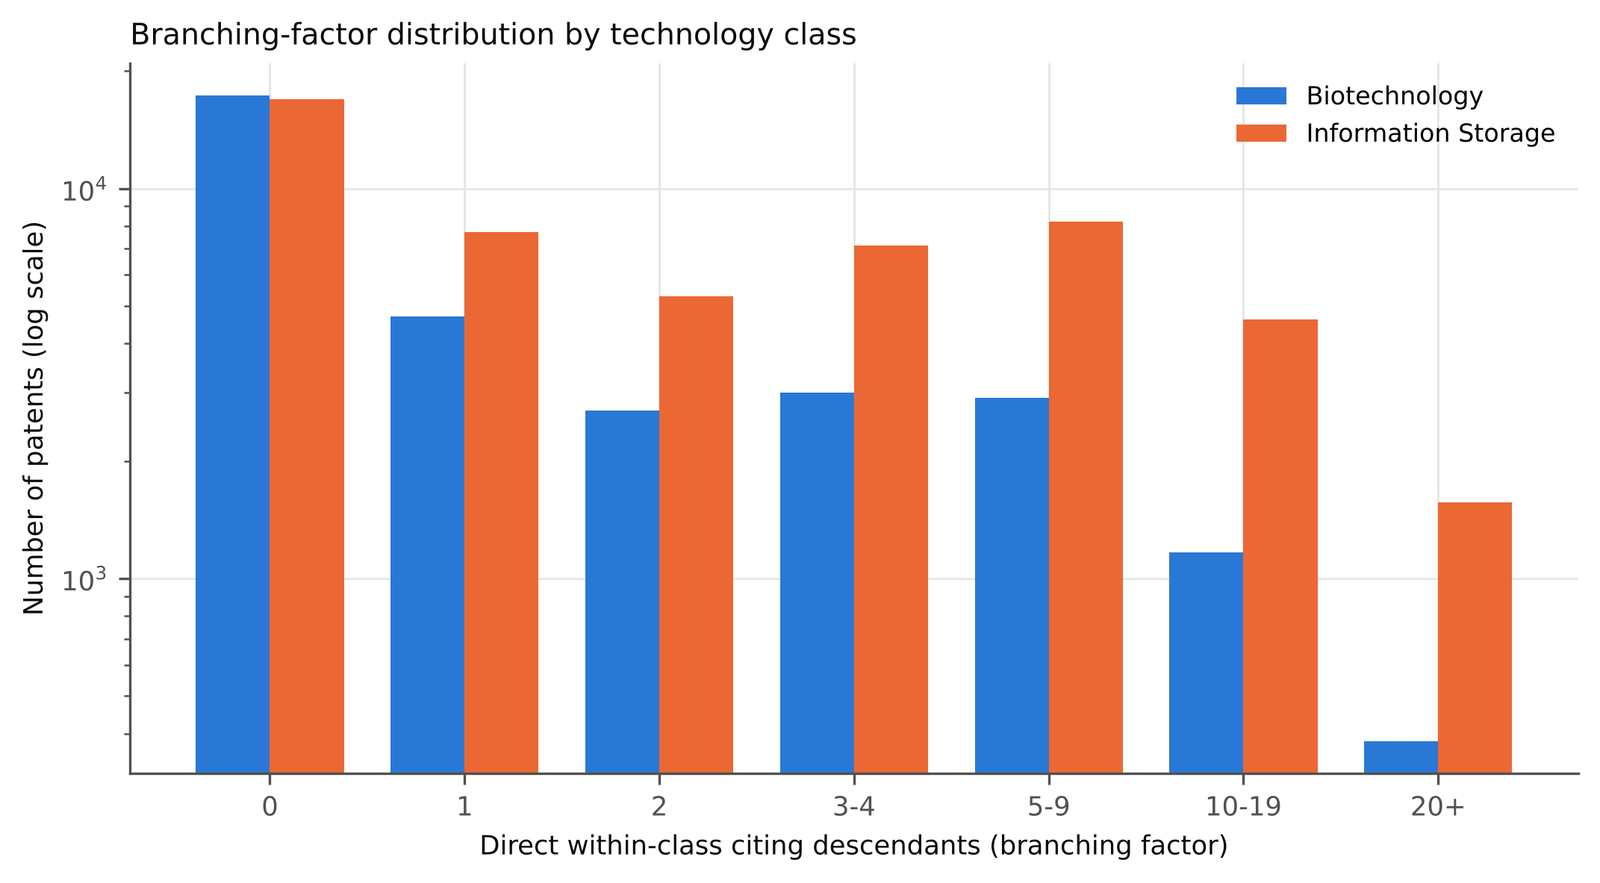

Table 1. Class-level summary, 1963-1999 (citations recorded 1975-1999)
| Biotechnology (USPC 435, 800) | Information Storage (USPC 360,365,369,711) | |
|---|---|---|
| Patents | 32,170 | 51,460 |
| Intra-class citation edges | 68,246 | 203,974 |
| Root patents (no in-class ancestor) | 12,197 (37.9%) | 11,164 (21.7%) |
| Maximum lineage depth (generations) | 13 | 19 |
| Mean branching factor | 2.12 | 3.96 |
| Median branching factor | 0 | 2 |
| Never cited within class | 53.9% | 32.9% |
| Median extinction age among ever-cited (years) | 9 | 9 |
| Mean extinction age among ever-cited (years) | 11.12 | 11.33 |
| Right-censored at 1999 among ever-cited | 72.7% | 89.1% |
Table 2. Highest-fan-out patents (most direct within-class citing descendants)
Biotechnology
| Patent | Grant year | Direct within-class citing descendants |
|---|---|---|
| US 4683195 | 1987 | 508 |
| US 4683202 | 1987 | 495 |
| US 4358535 | 1982 | 230 |
| US 4237224 | 1980 | 173 |
| US 4376110 | 1983 | 153 |
| US 4965188 | 1990 | 151 |
| US 4394443 | 1983 | 126 |
| US 4800159 | 1989 | 123 |
Information Storage
| Patent | Grant year | Direct within-class citing descendants |
|---|---|---|
| US 5043940 | 1991 | 116 |
| US 5172338 | 1992 | 114 |
| US 5077691 | 1991 | 107 |
| US 5163021 | 1992 | 107 |
| US 4933785 | 1990 | 99 |
| US 4669004 | 1987 | 98 |
| US 5053990 | 1991 | 98 |
| US 5025335 | 1991 | 91 |
Note: US Patent 4,683,195 (granted 1987), titled “Process for amplifying, detecting, and/or-cloning nucleic acid sequences” (title verified via OSTI biblio record osti.gov/biblio/6081384), is Kary Mullis’s foundational PCR patent. US Patent 4,683,202 (granted the same year, 1987), titled “Process for amplifying nucleic acid sequences” (title verified via uspto.report/patent/grant/ 4683202), is the closely related companion PCR patent. Together these two account for the largest fan-out in the Biotechnology class by a wide margin, consistent with PCR’s well-documented role as a foundational biotechnology method.
4. Discussion
The comparison is consistent with a simple, intuitive story: Information Storage, an area with a longer continuous history by 1963, shows deeper and more heavily branching citation lineages, while Biotechnology, much of whose patenting activity in this dataset is concentrated in the 1980s and 1990s, shows shallower lineages with a larger “never cited” fraction simply because many of its patents had less time within the window to accumulate citations at all. This reading is consistent with the broader literature’s use of patent citation networks to trace a single technology’s historical trajectory (Verspagen, 2007), extended here to a direct, matched comparison between two classes using one dataset and one pipeline, which is the paper’s modest contribution: not a new method, but a transparent, fully reproducible instance of an established one, applied to a specific, well-defined pair of technology classes rather than to the patent corpus as a whole.
The PCR patents’ outsized fan-out (Table 2) is a useful sanity check as much as a finding: a technique known from the general history of molecular biology to have been unusually foundational shows up, without being sought out in advance, as the single largest branching point in this class’s citation graph. That kind of face validity is reassuring given that the pipeline itself has not been checked against any other published patent-citation-network study using exactly this definition of branching and extinction age.
5. Limitations
Several limitations should be weighed before reading too much into the comparison above.
First, and most importantly, this is historical, static data, not a current snapshot of either technology class: patents are limited to those granted 1963-1999, and citation data exists only for citations made by patents granted 1975-1999 (USPTO citation recording in this file begins then). Everything after 1999 is simply absent. The underlying NBER/SNAP files have not changed since their 2009 release.
Second, the extinction-age and right-censoring statistics are confounded with each field’s growth trajectory within the window. Because the data stops abruptly at 1999, a patent whose “last” in-class citation happens to land in 1999 cannot be distinguished, from this data alone, between “this lineage is still active” and “this lineage happened to receive one more citation right as the window closed.” Information Storage’s much higher right-censoring rate (89.1% vs. 72.7%) is plausible given its longer, more continuous history by 1963, but this analysis does not attempt a formal survival model (e.g., Kaplan-Meier) that would properly account for censoring; the reported means and medians among “ever-cited” patents should be read as simple descriptive summaries, not survival-adjusted estimates.
Third, scoping citation edges to “both citing and cited patent are in the same NBER subcategory” is a deliberate simplification. It excludes cross-class citations entirely, which understates each patent’s total citation count and could understate branching in a technology that draws heavily on, or feeds into, adjacent fields. The choice was made for tractability and a clean within-class definition of “lineage,” not because cross-class citation is unimportant.
Fourth, the two classes compared here (Biotechnology; Information Storage) were chosen for contrast, not drawn from a larger, systematic sample of technology classes, so the specific magnitudes of the differences reported should not be generalized to “young versus established fields” broadly without testing additional classes.
Fifth, and specific to how this paper was produced: the analysis pipeline ran as a documented browser script against the live NBER source rather than this series’ usual local Python-against- local-raw-data pattern, for reasons described in the Methods and in results/provenance.md. The totals it recovered are consistent with NBER’s own description of the full dataset (“almost 3 million” patents, “over 16 million” citations), which is some evidence the parsing and filtering logic is correct, but an independent reviewer checking this paper’s numbers needs to re-run that browser script (or an equivalent one against a locally downloaded copy of the same two files) rather than a local Python script against local raw files, which is a genuine, if narrow, departure from how the rest of this series can be audited.
Related on x9m8
- Does Technology Evolve Like Life? What Cultural Phylogenetics Shows
- Can You Patent a Gene? What Myriad Closed Off and What Is Still Patentable
- Where the CRISPR Patent Dispute Stands in October 2026: Broad v. CVC
- Trade Secrets vs Patents in Biotech: Which Protection Fits Which Invention
- Open Questions: a series on what science and law have not settled
Research transparency and reproducibility statement
All data are public and require no login (data.nber.org/patents/apat63_99.zip, data.nber.org/patents/acite75_99.zip; see results/provenance.md for exact retrieval timestamps and SHA-256 hashes of the files used). All code is included in code/: browser_pipeline.js (the pipeline that produced every number in this paper, run against the full source files) and the Python scripts load.py, analysis.py, figures.py, tables.py, graphical_abstract.py, style.py (which reproduce the figures, tables, and derived comparative statistics from the committed results/analysis.json, results/derived.json, results/hub_patents.json, and results/example_lineage_tree.json). A non-fabricated row-level sample of the filtered data is in data/raw/. No preregistration exists; this is a secondary analysis of existing public data and a preregistration would not meaningfully apply.
Acknowledgements
Claude (Anthropic, accessed via Claude Code, 2026-11) assisted in writing the analysis pipeline, producing figures and tables, and drafting this manuscript; all output was reviewed by the author, who is responsible for its content.
Author contributions
Peter Kalafatis is the sole author: conceptualization, data retrieval, analysis, writing.
Financial support
This research received no specific grant from any funding agency, commercial, or not-for-profit sector.
Conflicts of interest
None.
References
Hall, B. H., Jaffe, A. B., & Trajtenberg, M. (2001). The NBER patent citation data file: Lessons, insights and methodological tools (NBER Working Paper No. 8498). National Bureau of Economic Research. https://doi.org/10.3386/w8498
Leskovec, J., Kleinberg, J., & Faloutsos, C. (2005). Graphs over time: Densification laws, shrinking diameters and possible explanations. In Proceedings of the Eleventh ACM SIGKDD International Conference on Knowledge Discovery and Data Mining (pp. 177-187). Association for Computing Machinery. https://doi.org/10.1145/1081870.1081893
Verspagen, B. (2007). Mapping technological trajectories as patent citation networks: A study on the history of fuel cell research. Advances in Complex Systems, 10(1), 93-115. https://doi.org/10.1142/S0219525907000945