





NASA released over 800 GB of Artemis II lunar data and a preliminary science report. Here is what the crew saw, what the report concludes, and what is still unanalysed.
Five faint pinpricks of light, each from a rock only a couple of inches wide, are the headline result of NASA’s first look at what the Artemis II crew saw at the Moon. They appeared while Orion was behind the lunar far side and out of contact with Earth, and the astronauts saw them with their own eyes. In early October NASA published the evidence: a very large dataset, a preliminary science report, and two companion documents. This post goes through what is in them.
The material matters beyond the pictures. It is a record of how trained people, not instruments alone, pick targets, judge colour and describe terrain from a spacecraft window. Readers who want the trajectory first can start with our earlier piece on the Artemis II flyby, the free-return path and the heat shield. Everything below is reported from NASA’s documents and three outside outlets, and where a statement is interpretation rather than reporting, it is marked as such.
What NASA released
NASA posted the lunar science dataset on October 7, 2026, through its Missions blog. According to the NASA announcement, it totals more than 800 gigabytes and sits in the agency’s Planetary Data System, the public archive for planetary missions. Some of it had not been released before.
The contents, as NASA lists them:
- More than 11,000 full-resolution images and video of the Moon, from the crew’s handheld cameras and Orion’s own cameras.
- 8.5 hours of audio of the crew describing the lunar surface.
- Images the crew marked up by hand, with accompanying notes on what they saw.
Three documents came with it: the preliminary science report, a lunar science operations report describing how the science plan was built and run, and a data user guide. The archive itself is at the PDS Geosciences node.
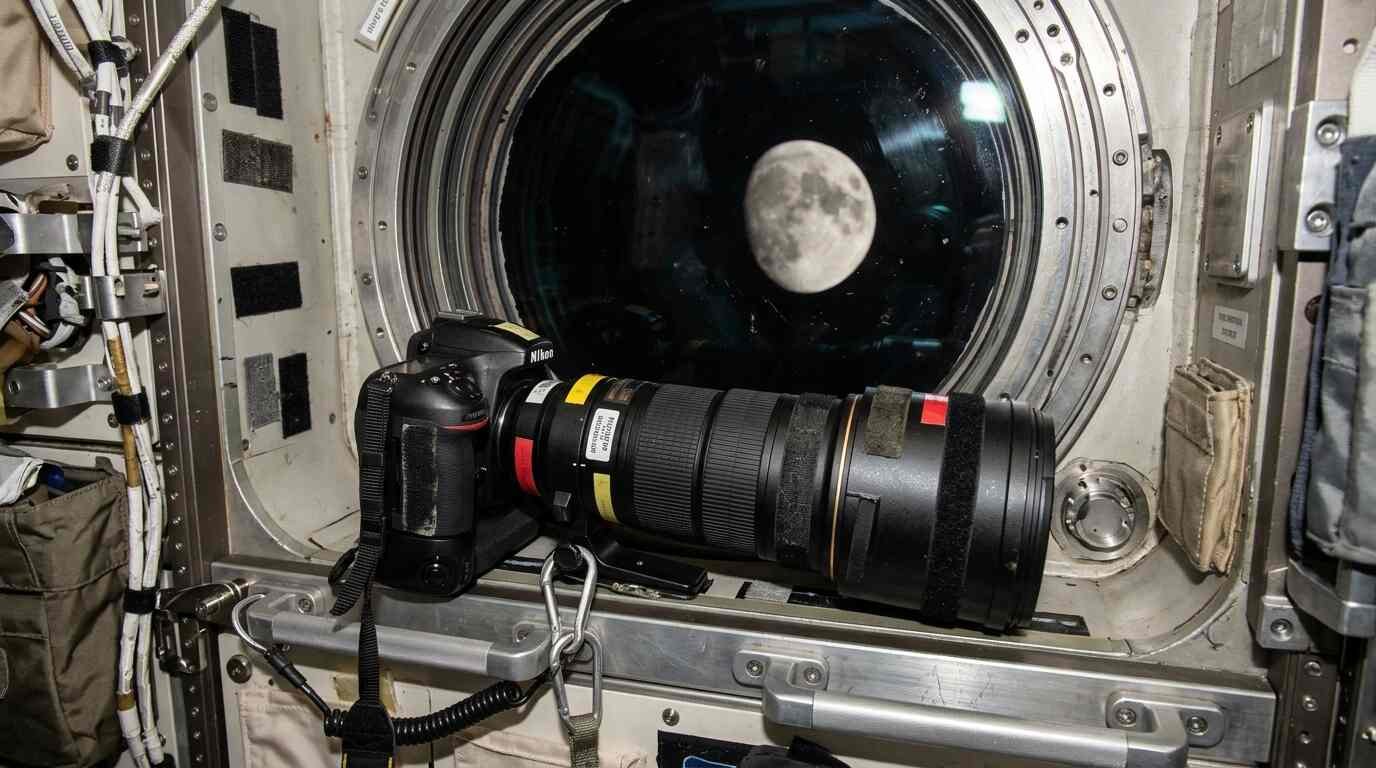
The user guide gives the practical detail. Crew photographs came mainly from two Nikon D5 bodies and a Nikon Z9, plus a small set from an iPhone 17 Pro Max that was still being prepared when the guide was written. Orion’s cameras include modified GoPro Hero 4 Black units and two monochrome cameras. Crew camera files are native .nef raw files with converted TIFFs. The archive holds source, raw and partly processed products only; the guide says there are no calibrated or derived products. The data user guide also warns that the forward windows are three-layer stacks that were not characterised before flight, and that no colour calibration was done for the sensors or through the glass.
Counts differ between outlets, and the reason is scope. Scientific American reports 12,217 photographs from the whole mission on the Gateway to Astronaut Photography of Earth site, whereas NASA’s 11,000-plus figure refers to lunar images and video in the science release. The same article notes that image codes run well past what has been posted, so more may follow.
What the crew observed and how
The flyby happened on April 6, 2026, the sixth day of the mission. At closest approach Orion passed within 4,067 miles of the surface, and the crew spent about seven hours at the windows, according to the preliminary report page. The crew were NASA astronauts Reid Wiseman, Victor Glover and Christina Koch, and Jeremy Hansen of the Canadian Space Agency.
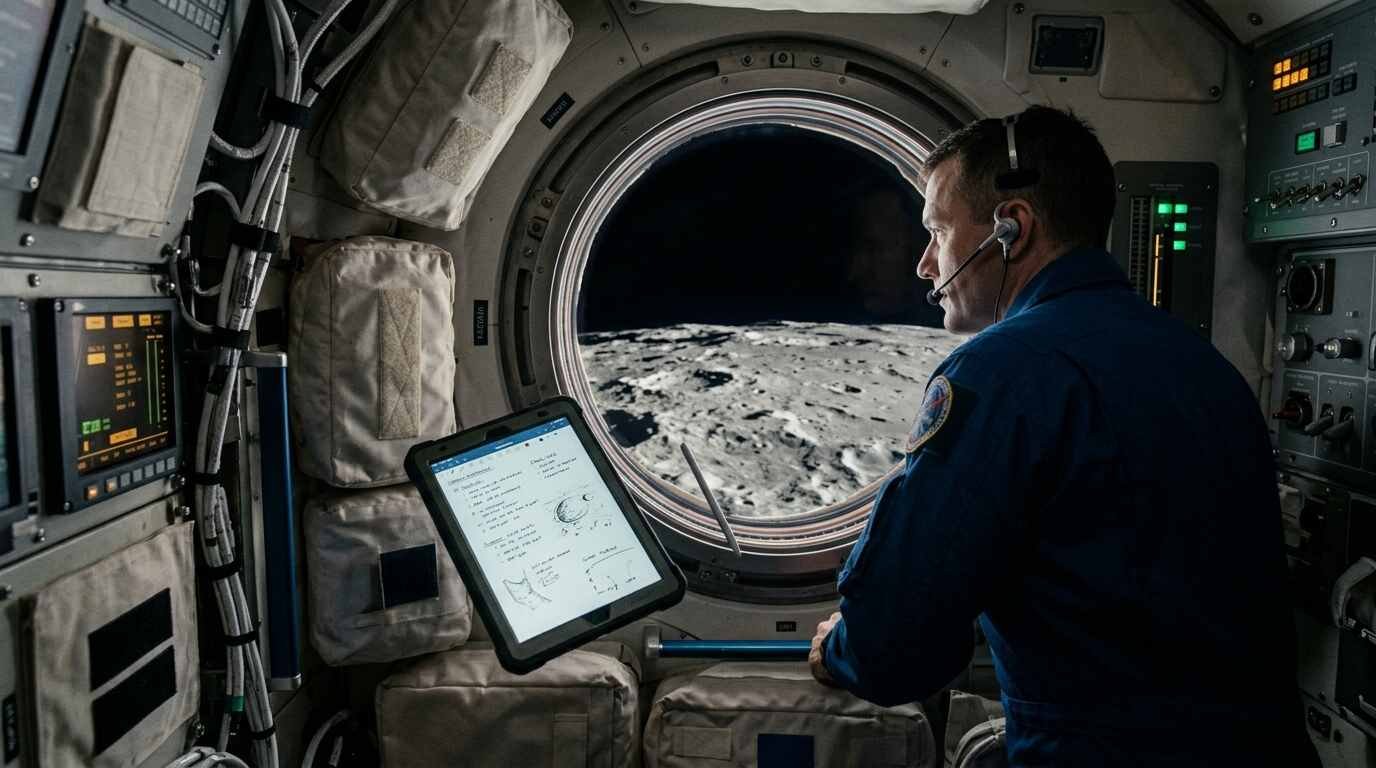
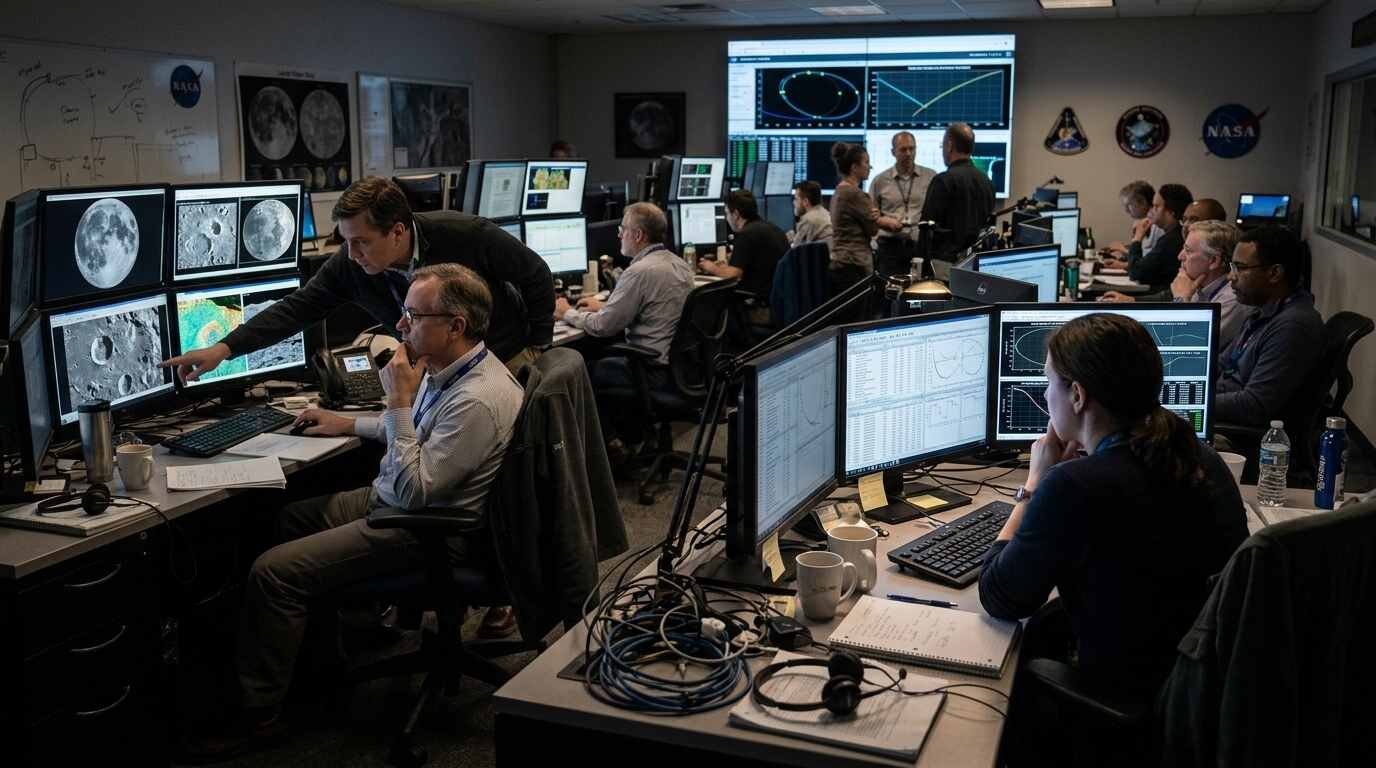
Their method was plain. They looked, photographed, talked and drew. Spoken observations were recorded as audio. Annotations were made on tablet screenshots in OneNote, and the guide says four Surface Pro tablets were used, one of which failed partway through the mission. Afterward, scientists matched photos to precise lunar locations and set them against data from NASA’s Lunar Reconnaissance Orbiter.
Six themes organise the report.
- Impact flashes. Scientists had asked the crew to watch for brief flashes from rock fragments hitting the Moon. The crew reported five, seen from about 46,000 miles away during a planned communications loss on the far side. The science team says it ruled out cosmic rays and spacecraft reflections first, and estimates the impactors at no more than a couple of inches wide, moving thousands of miles per hour. Three of the flashes came roughly ten minutes into the eclipse, per Wiseman’s note.
- Surface colour. The crew described grays, blacks, browns, tans, whites, greens and blues. The report reads blues as titanium-rich volcanic rock, browns as differing iron content, and greens as glass from eruptions or impacts.
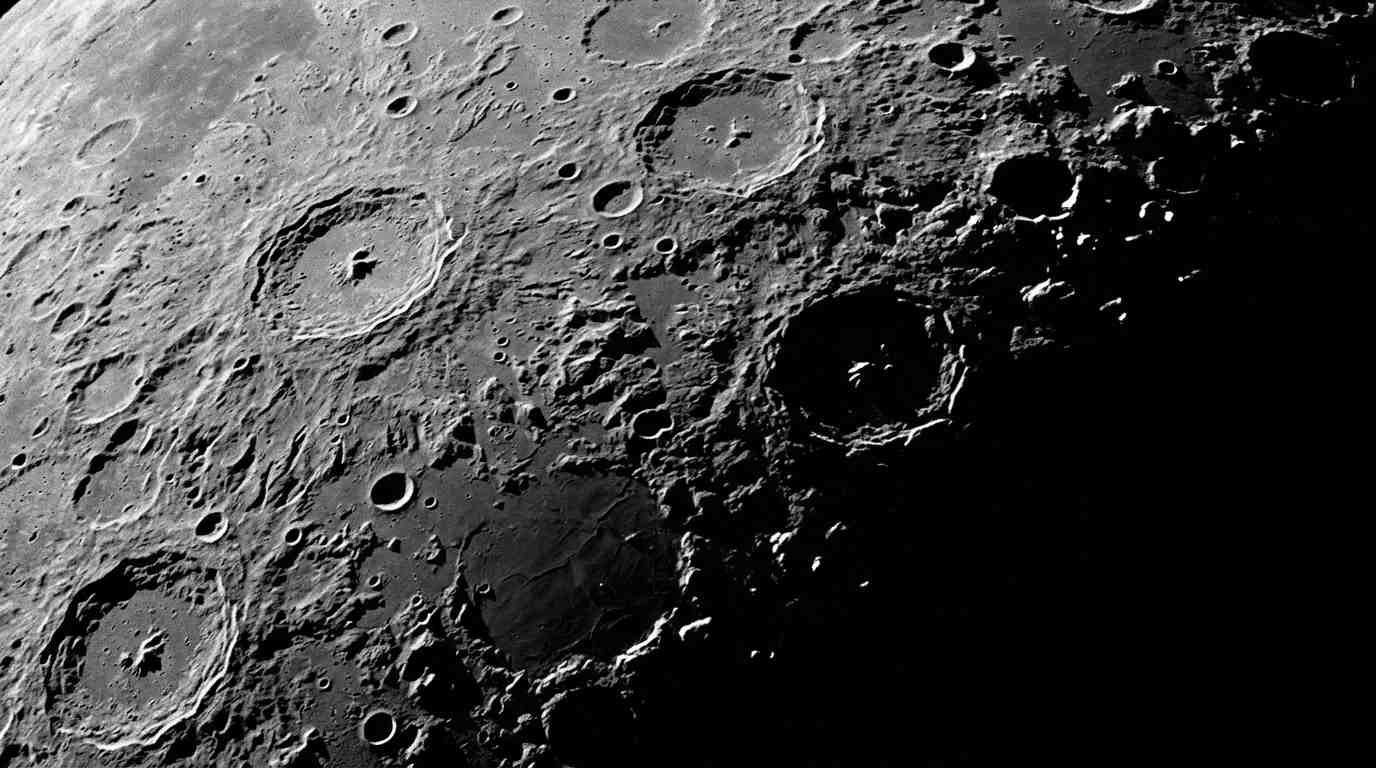
- The terminator. Low-angle light along the day-night line gave strong relief on craters and mountains, including the large crater Carnot, nearly 80 miles across. NASA compares that lighting to conditions near the lunar South Pole, a target for later Artemis missions.
- Eclipse and far side. Orion lost the Sun for about 54 minutes. In that dark interval the crew saw stars, galaxies, zodiacal light, planets and the solar corona, including a pulsating plasma streamer that Hansen marked on his screenshot.
- Earth. A night image taken April 2 from about 6,000 miles showed auroras at both poles, a Saharan dust plume and lightning over the Congo basin.
- Orientale Basin. Crew photos were combined with LRO elevation, roughness, rock abundance and albedo layers into a single set of panels.
Interpretation, as opposed to observation, enters with the colours. As NEOTEO stresses, these readings are preliminary, and the guide’s missing colour calibration is a reason to treat a perceived blue as a lead rather than a measurement.
What the preliminary report says (and what ‘preliminary’ means)
The report concludes that the crew’s observations form a unique scientific record. Three specific claims stand out. The flash data can help estimate how often small impacts occur, which bears on risk to future lunar habitats. The observations can inform camera selection and planning for later missions. And the flight tested how NASA folds science into a crewed lunar mission, with new science operations teams and flight controller roles.
The word itself is not defined on NASA’s page. Reading it from context, it marks an inventory and first interpretation, not a finished analysis. Scientists are still linking the descriptions, photographs and annotations to one another. NASA also says accessible versions of the full-length reports are in progress.
The operations report is where the candid material lives. As summarised by New Space Economy, it recommends keeping a Science Officer in the front flight control room, giving long-term analysis dedicated roles, and considering at least one camera with an optical viewfinder. That last point has a concrete origin: the D5’s optical viewfinder worked as a monocular for comparing views, which the Z9’s electronic viewfinder could not. The outlet adds that these are recommendations, not decisions; each would need separate choices on staffing, training and hardware.
One caution on the flash count. NASA’s report says five. Another outlet’s summary of the image releases mentions six, so a reader comparing coverage should treat NASA’s documents as the reference.
How this compares with Apollo-era lunar observation
Only a few comparisons can be sourced, and they are modest.
On the flashes, the report itself says Apollo astronauts also saw similar flashes from lunar orbit. Its point is that these were likely the faintest ever seen with the unaided eye. On scale, NASA’s announcement calls the release the first planetary science dataset captured primarily by humans in more than half a century, and says the crew’s choices of targets, colour perceptions and discussions add to decades of Apollo and robotic data. On imagery, Universe Today notes that the set includes an earthrise and earthset like those Apollo missions recorded.
One distinction is mine, not NASA’s, and rests on the mission profile: Artemis II was a flyby with no landing and no lunar orbit, a point covered in our flyby explainer. That limits what the crew could reach, so the value here lies in the structured record and the pairing with LRO data, not in samples or in-place measurements. Nothing in the sources I read compares the quantity or quality of the data against any individual Apollo flight, so I will not claim one.
What happens next
The data are open. NASA says it is releasing them to the global science community and the public for further study. Analysis will continue on several fronts: comparing crew descriptions with LRO data to see how lighting and viewing angle shape perception, refining the impact-flash timing and locations, and turning the flash observations into a rate estimate, which the sources describe only as a possible use.
The archive may also grow. Scientific American says the science team, about 60 people, had until October to publish the preliminary and operations reports and the full dataset, and that the images and voice recordings were headed for the Planetary Data System. NASA says the data are already informing plans for Artemis III and beyond.
A speculative note, flagged as opinion: the colour work and terminator lighting point toward South Pole planning, and anything that sharpens knowledge of volcanic glass and titanium-rich rock will eventually touch questions of who may use such material, which our piece on lunar resources law covers. Nothing in NASA’s documents makes that link; it is a reader’s inference.
Sources
- NASA, NASA Releases Artemis II Lunar Science Data, Images (October 7, 2026)
- NASA Science, Artemis II Preliminary Lunar Science Report
- NASA, Artemis II Lunar Science Data User Guide (PDF)
- Planetary Data System Geosciences Node, Artemis II archive
- Scientific American, NASA just dropped more than 12,000 Artemis II photos
- NEOTEO, NASA reports five faint flashes in preliminary Artemis II lunar findings
- New Space Economy, What changes does the Artemis II science operations report recommend
- Universe Today, NASA releases images of Artemis II’s flight behind the Moon