







Daily Pacific temperatures have topped the 2015 record, but NOAA ranks El Niños differently. What the numbers mean, why they disagree, and what forecasters expect through early 2027.
The 2026 El Niño has pushed the tropical Pacific into territory that forecasters call historic. On 21 September, daily sea surface temperature in the central and eastern equatorial Pacific stood 3.08 °C above the 1991 to 2020 average, edging past the previous daily record of 3.02 °C set in November 2015, according to Science News Explores. A few weeks on, the numbers are still climbing.
Yet NOAA has not called it the strongest on record. That apparent contradiction is the most useful thing to understand about this event, and it comes down to what gets measured, over what period, and relative to what. NOAA’s Climate Prediction Center, in its 8 October discussion, put the chance that the event becomes stronger than any since 1950 as high.
This article sorts out the competing figures, explains the physics that drives an El Niño, and lays out what forecasters expect through early 2027. Everything below comes from NOAA’s 8 October discussion and three press or blog summaries published between 5 and 8 October. Several figures are preliminary, and I have flagged where sources differ.
The numbers at a glance
| Measure | Reported value | Source |
|---|---|---|
| Daily sea surface temperature anomaly, central and eastern equatorial Pacific, 21 September | +3.08 °C against the 1991 to 2020 average; previous daily record +3.02 °C (November 2015) | Science News Explores |
| Niño 3.4 absolute temperature | Above 30 °C for the first time on record, based on preliminary data cited 5 October | Live Science |
| Niño 3.4 anomaly, 6 October | About 3.34 °C above average and rising | Live Science |
| NOAA status, 8 October | El Niño Advisory; Niño-3.4 +2.1 °C, Niño-3 +3.0 °C, Niño-1+2 +3.9 °C | NOAA Climate Prediction Center |
| Peak local anomalies | Above +4.0 °C in parts of the eastern equatorial Pacific | NOAA Climate Prediction Center |
| Subsurface warmth | Above +10.0 °C at depth in the eastern Pacific | NOAA Climate Prediction Center |
| Relative index (RONI), July to September | 1.7 | Climate.us summary of NOAA |
| Chance of a three-month RONI of +2.5 or higher | 54% (Sept to Nov), 83% (Oct to Dec), 70% (Nov to Jan) | NOAA Climate Prediction Center |
How an El Niño works
In a normal year, steady trade winds blow from east to west across the tropical Pacific. They pile warm surface water into the west, near Indonesia, and let cold water well up off South America. The warm pool fuels towering rain clouds over the west, and the contrast between warm and cold sides keeps the winds blowing.
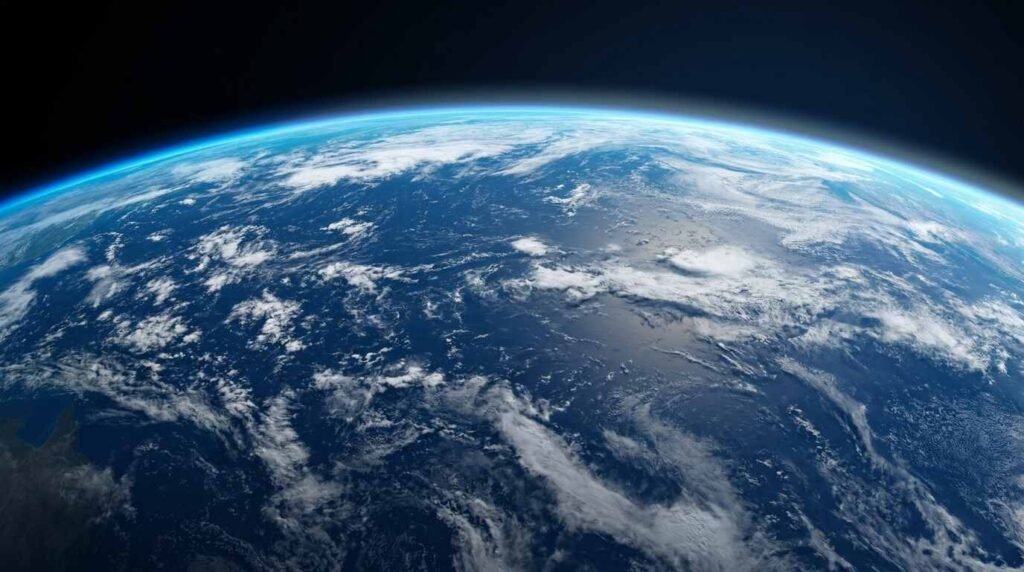
An El Niño begins when that loop weakens. The winds ease, warm water slides back toward the east, and the cold upwelling off South America shuts down. With the eastern ocean warmer, the winds weaken further, which warms the ocean more. That self-reinforcing cycle is the core of the phenomenon. Rain clouds follow the warm water east, and the shift in tropical heating bends the jet streams and rearranges weather around the globe.
NOAA’s October discussion mentions subsurface temperatures more than 10 °C above normal at depth in the eastern Pacific. That reservoir of heat below the surface is part of why forecasters expect the event to keep strengthening: warm water lies waiting beneath the surface layer.
Why the numbers disagree
The traditional way to rank an El Niño is the Oceanic Niño Index, which averages the sea surface temperature anomaly in the Niño 3.4 region over three months. Three-month averaging smooths out short-lived spikes, so a single record day does not by itself make a record event.
NOAA has also moved to a relative index, the RONI. According to Climate.us, it subtracts the tropics-wide average temperature from the regional anomaly. The reasoning is that background warming lifts the temperature of the whole tropical ocean, and what drives atmospheric changes is how much warmer the central Pacific is compared with the rest of the tropics. By that measure the 1997 to 1998 event still tops the 2026 event, and NOAA’s forecast from 10 September projected that it would soon be surpassed, according to Science News Explores.
Then there are the datasets. Daily analyses, weekly values and monthly averages differ, and different groups define the boxes they average over. The Live Science figure of more than 30 °C is an absolute temperature rather than an anomaly, and the article itself notes that absolute temperature is not the standard measure of strength. Niño 3.4 is far from the western warm pool and is usually much cooler. The article cites preliminary data, credits its chart to ClimateReanalyzer.org, and quotes Jin-Yi Yu of the University of California, Irvine as saying the record would be extraordinary if it is verified in the observational dataset.
Is it a record?
That depends on the ruler. By daily sea surface temperature, Science News Explores says the event is already stronger than any in recorded history. By NOAA’s relative index, the formal record still belongs to 1997 to 1998, and NOAA ranks events using three-month averages.
The forecast probabilities are the most telling numbers. NOAA gives an 83% chance that the October to December three-month RONI reaches +2.5 or higher, the threshold that would exceed all El Niño events since 1950. The chances are 54% for September to November and 70% for November to January. Those are probabilities, not certainties.
Timothy Osborn of the University of East Anglia told Live Science that on relative measures the event is close to the strongest on record and is likely to exceed previous records. Mat Collins of the University of Exeter cautioned that El Niño is highly variable, and that not every event will set records.
A fast transition, and a different flavor
Science News Explores reports that the Pacific swung from La Niña to strong El Niño in less than a year, possibly the fastest such transition observed. A rapid swing matters because less time means the atmosphere and ocean have less opportunity to adjust before extremes arrive.

Live Science also raises a separate question about where the warming sits. Researchers distinguish an eastern Pacific type of El Niño from a central Pacific type, which has become more prominent in recent decades. Yu suggests global warming may be strengthening atmosphere and ocean interactions in the subtropical Pacific, and that if these combine with processes along the equator they could produce unusually strong central Pacific events. That is a hypothesis, and Yu also cautions against assuming every El Niño will grow stronger.
What forecasters expect next
- Peak timing. Nathaniel Johnson of NOAA’s Geophysical Fluid Dynamics Laboratory expects the event to peak within the next few months. Collins expects a Niño 3.4 peak in November or December, with a decline in 2027. NOAA’s discussion says the event will keep strengthening through the end of the year.
- Duration. The event will likely weaken after winter and end by spring or early summer. A shift to La Niña the following year is possible, and a double La Niña is also possible.
- Hurricanes. Science News Explores lists a suppressed Atlantic hurricane season and an enhanced Pacific one as likely.
- Rainfall. Droughts in Central America and northern South America, and a weaker Indian monsoon. Live Science adds drought in Indonesia, the Philippines and southern Africa, and heavy rain in East Africa, southern China and the southern United States.
- Winter in North America. A wetter southern United States, a drier Pacific Northwest and a warmer northern United States and Canada, later in the season.
- Coastal flooding. Climate.us notes that El Niño raises sunny-day high-tide flooding in Hawaii, the West Coast, the western Gulf of Mexico and the Mid-Atlantic during the cool season.
NOAA stresses that El Niño impacts are more likely with an event of this size but not guaranteed. A University of Chicago Climate Impact Lab report, cited by Science News Explores, estimates that the ocean heat could raise global land temperatures by about 1.2 °C in coming months and cause more than 450,000 additional heat-related deaths by next February. That is a projection from one group’s model, and I have not seen the underlying report.
What remains unsettled
Whether human-caused warming made this event stronger is open. Johnson says there is no scientific consensus yet. Nathan Lenssen notes that a warmer ocean holds more energy for El Niños to release. Osborn is explicit that this event does not mean extreme El Niños are the new normal.
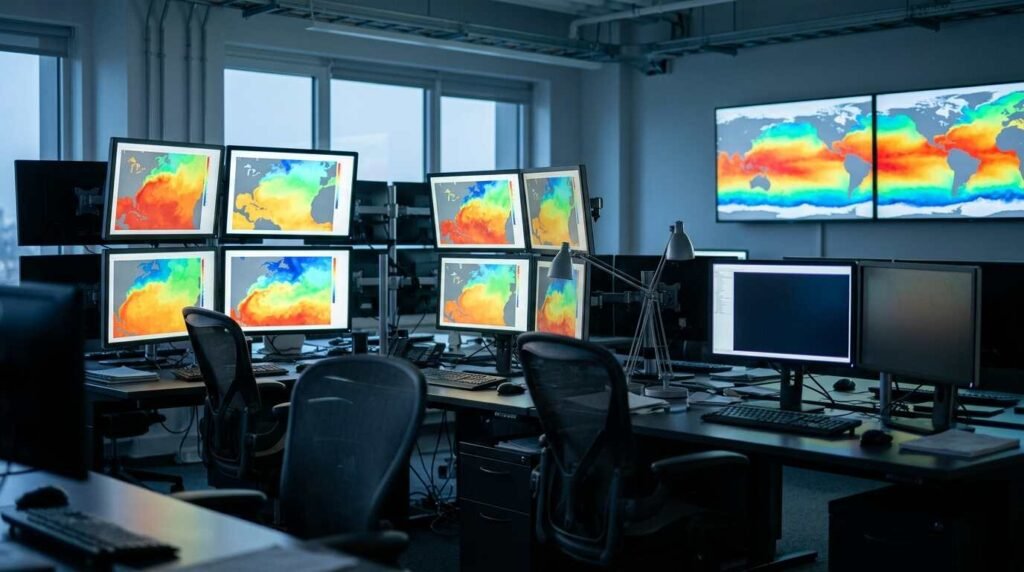
NOAA’s next discussion is scheduled for 12 November, and the three-month RONI values for October to December will not be known until early next year. Until then the record question remains a forecast rather than a fact.
A short glossary
- Niño 3.4: the region of the central and eastern equatorial Pacific, roughly 5°N to 5°S and 120°W to 170°W, used to track El Niño.
- Anomaly: a departure from the long-term average for that place and time.
- Oceanic Niño Index: the traditional three-month average of the Niño 3.4 temperature anomaly.
- Relative Oceanic Niño Index (RONI): NOAA’s newer measure, which subtracts the tropics-wide average to isolate the Pacific’s contrast with the rest of the tropics.
- Thermocline: the layer of ocean where temperature drops quickly with depth.
Frequently asked questions
Is 2026 the strongest El Niño ever recorded?
By some daily measures it already is. By NOAA’s three-month relative index the 1997 to 1998 event still leads, but NOAA gives an 83% chance that October to December reaches the +2.5 threshold that would beat everything since 1950.
Why does NOAA use a relative index?
Background warming raises the whole tropical ocean, so subtracting the tropics-wide average isolates the contrast that drives atmospheric change.
When will the event peak?
Experts quoted by Science News Explores and Live Science expect a peak within the next few months, likely November or December, with weakening after winter.
Does El Niño guarantee extreme weather?
No. NOAA says impacts are more likely with an event this strong, though not guaranteed.
When is NOAA’s next update?
12 November 2026.
Sources
- NOAA Climate Prediction Center: ENSO Diagnostic Discussion (8 October 2026)
- Science News Explores (Nikk Ogasa, 5 October 2026, updated 6 October): 2026’s El Niño is record-breaking and it’s not done yet
- Climate.us ENSO Blog (Rebecca Lindsey, 7 October 2026): Highlights from NOAA’s October 2026 El Niño forecast
- Live Science (Sascha Pare, 8 October 2026): the central Pacific just broke a temperature record