


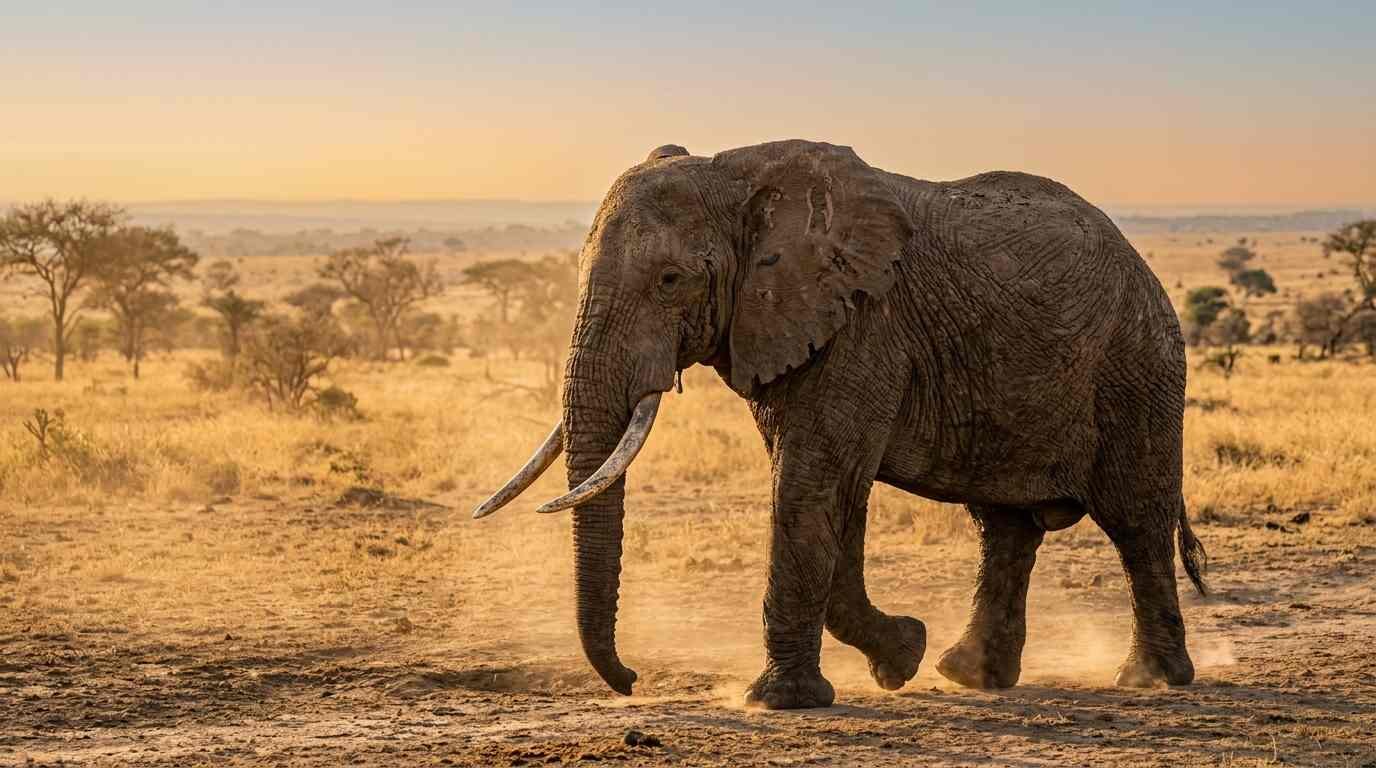
Big, long-lived animals should get far more cancer than they do. Here is what the evidence shows about Peto's paradox, the competing explanations, and a small model of how much protection a giant actually needs.
Peto’s paradox is the observation that big, long-lived animals do not get cancer at the rates their size seems to demand. A blue whale carries something like a thousand times as many cells as a person, and every one of those cells divides, copies its DNA, and occasionally gets it wrong. If cancer were only a matter of rolling enough dice, whales would be riddled with tumors. As far as anyone can tell, they are not, and neither are elephants. The puzzle has a name and a decent body of evidence behind it. It does not yet have a settled answer.
This article lays out what is known, the main competing explanations, and a small model built for this piece that asks a narrow question: how much extra protection would a giant animal actually need?
The question, stated precisely
The clean version goes like this. Within one species, cancer risk climbs steeply with age. Across species, the expected link with size and lifespan mostly fails to appear. Each cell division is a chance to pick up a mutation, and a cancer needs several specific mutations in one cell lineage. More cells and more years should multiply the chances. So why is lifetime cancer mortality in an elephant not dozens of times higher than in a human, and why is a mouse not almost cancer-free?
That framing hides two separate puzzles. One concerns body size (cell count). The other concerns lifespan (time for mutations to pile up). They need not have the same solution, and the evidence for each is different.
The question is not an idle one. Searching for it turns up a steady supply of popular explainers with titles such as “Why Don’t Blue Whales Get Cancer?”, a short video on the same theme, and forum threads where readers pick it apart. If evolution repeatedly found ways to make huge bodies resist cancer, those mechanisms are leads for human medicine.
What the evidence has established
For a long time the paradox rested on anecdote: zoo vets and whalers simply did not see much cancer in large animals. That changed with Vincze and colleagues (2022), who used zoo records covering 110,148 adult mammals from 191 species. Cancer-related mortality ranged from zero to over 57 percent depending on the species, and it exceeded 10 percent in 41 species, so cancer is plainly common in many managed mammals. Carnivores fared worst; the order containing cattle, deer and giraffes (Artiodactyla) fared best. Species that frequently ate other mammals had the highest rates. On the core question, the authors reported a finding that matters here:
“cancer mortality risk is largely independent of both body mass and adult life expectancy across species”
Vincze et al., 2022, Nature
Two caveats apply. Zoo animals live longer, eat differently and get veterinary care, and the very largest mammals, the great whales, sit outside the dataset entirely. Still, this is the strongest direct test so far, and it supports the paradox rather than dissolving it.
A second line of evidence comes from the genomes of normal cells. Cagan and colleagues (2022) sequenced 208 intestinal crypts from 56 individuals across 16 mammal species, from mice and naked mole-rats to giraffes, tigers and a harbour porpoise. The yearly somatic mutation rate varied widely between species and fell as lifespan rose. The striking result was how little the total burden varied by the end of life, despite enormous differences in size:
“including variation of around 30-fold in lifespan and around 40,000-fold in body mass”
Cagan et al., 2022, Nature
According to the paper’s abstract, end-of-life burden differed only by a factor of about three. A Wellcome Sanger Institute summary gives roughly 20 to 50 new mutations per year for human intestinal cells. The paper also states the paradox in its own terms: body mass shows no correlation with cancer risk across species, which suggests large bodies required stronger cancer suppression to evolve.
Notice what this result explains and what it leaves open. A slower mutation clock in long-lived species goes a long way toward the lifespan half of the puzzle. It says much less about the size half, because a slower clock per cell still leaves a whale with vastly more cells than a mouse.
Hypothesis one: big bodies bought extra tumor suppression
The most famous answer comes from elephants. The tumor suppressor gene TP53 encodes p53, a protein that pauses or kills cells with damaged DNA. Humans have one copy per genome (two alleles). A 2015 bioRxiv preprint by Sulak, Lynch and colleagues reported that elephants have many more, in the form of retrogenes, copies made when a gene’s processed RNA was reverse-transcribed back into the genome. Its abstract states that “the elephant genome encodes 20 copies of the tumor suppressor gene TP53” and that:
“several of the TP53 retrogenes are transcribed and translated”
Sulak et al., 2015, bioRxiv preprint
The same abstract links these copies to elephant cells being more sensitive to DNA damage and more prone to apoptosis, programmed cell death. (Retrogenes are a product of the same copy-and-paste machinery behind jumping genes; for an unusual case of that machinery at work, see this site’s piece on a human jumping gene found inside a poxvirus.)
Elephants seem to have repurposed a second gene family too. Vazquez, Sulak, Chigurupati and Lynch (2018) described LIF6, a copy of the LIF gene that had been nonfunctional and appears to have been brought back into service. Their abstract says that “LIF6 is transcriptionally upregulated by TP53 in response to DNA damage”; the resulting protein moves to mitochondria and triggers cell death. Their phylogenetic analysis places the relevant regulatory element in the stem lineage of proboscideans, roughly when large body size evolved. The authors are careful on one point: they argue this change may have helped make large size possible, not that it was sufficient by itself.
Evidence for: a concrete mechanism, cell-culture data showing a stronger damage response, and timing that lines up with the evolution of large bodies. Evidence against, or at least missing: most of the work is in cultured cells, not living elephants. Nobody has shown that removing the extra copies raises cancer rates in an elephant, and that experiment will not be done. And a solution found by one lineage tells us little about whales, which reached giant size independently.
Hypothesis two: slower mutation clocks
A different family of answers says the per-cell risk itself falls in big, long-lived species, through better DNA repair, slower cell turnover, lower metabolic rate per cell, or simply fewer errors per year. The Cagan data are the best direct support. If mutations accumulate more slowly in long-lived species, the time half of the paradox shrinks considerably.
The idea is economical: no special gene per lineage, just a general tuning of mutation rate to lifespan. Its weakness is that measured mutation rates track lifespan more clearly than they track body mass. A slow mutation clock that keeps a long-lived animal’s cells from wearing out by old age does not automatically compensate for having thousands of times more cells.
Hypothesis three: the arithmetic is wrong
Some researchers suspect part of the paradox is an artifact of naive accounting. The relevant count is not total cells but cells at risk: long-lived stem cells and other dividing populations that can carry mutations forward. Those may not scale linearly with mass. Large cells, slower tissue turnover, and differences in how many divisions a lineage goes through would all weaken the link between size and risk before any special defense is needed.
A related idea concerns what happens after a tumor starts. In a very large animal, a tumor must grow much bigger before it kills, which gives more time for things to go wrong for the tumor, including competition among its own cell lineages. An early proposal aimed specifically at whales came from Nagy, Victor and Cropper (2007), titled “Why don’t all whales have cancer? A novel hypothesis resolving Peto’s paradox.” I could not access its full text, so I cite it by title only and do not characterize its model.
The data problem belongs here too. Cancer is hard to detect in wild animals, and the largest species are barely sampled. A paradox built on missing data could partly be a detection gap. The zoo study narrows that worry for mid-sized and large mammals; it cannot speak for blue whales.
A small multistage model built for this article
The three hypotheses make different quantitative demands, so it helps to put numbers on them. The model below is deliberately simple. It is a small simulation built for this article, not an analysis of real animal data, and every species parameter is a round illustrative value I chose.
The setup: a cell becomes malignant once it has lost every functional copy of TP53 (two hits in a human) plus three other driver events, five hits in total. Each event strikes a given cell at a constant rate u per year, independently. The probability that one cell has all its hits by age t is (1 − e−ut)hits, and lifetime risk across N at-risk cells is 1 − (1 − p)N. I calibrated u so that a human with 109 at-risk cells and an 80-year life has a 30 percent lifetime risk, then scaled cell number with body mass. The elephant was given 4,000 kg and 65 years, the blue whale 100,000 kg and 90 years, the mouse 25 g and 3 years.
import numpy as np
from scipy.optimize import brentq
# Multistage model: a cell turns malignant once it has lost every copy of TP53
# (m hits) plus j other driver events. Each event hits a cell at rate u per year.
def cell_p(u, t, hits):                 # P(all `hits` events occurred by age t)
    return (-np.expm1(-u * t)) ** hits
def risk(N, u, t, m=2, j=3):            # lifetime risk across N at-risk cells
    return -np.expm1(N * np.log1p(-cell_p(u, t, m + j)))
N_H, T_H, R_H = 1e9, 80.0, 0.30         # human calibration (assumed, not data)
u_H = brentq(lambda u: risk(N_H, u, T_H) - R_H, 1e-8, 1e-1)
species = {  # name: (mass kg, lifespan yr); round illustrative values
    "mouse": (0.025, 3), "human": (70, 80),
    "elephant": (4000, 65), "blue whale": (100000, 90)}
print(f"calibrated u = {u_H:.3e} per event per cell per year")
for name, (kg, T) in species.items():
    N = N_H * kg / 70                   # at-risk cells scale with body mass
    same = risk(N, u_H, T)              # human per-year rate
    scaled = risk(N, u_H * T_H / T, T)  # rate inversely tied to lifespan
    need = brentq(lambda f: risk(N, u_H * f, T) - R_H, 1e-6, 1e3)
    print(f"{name:10s} N={N:.1e} risk(same u)={same:.3g} "
          f"risk(u~1/lifespan)={scaled:.3g} u-factor for 30%={need:.3f}")
for name in ("elephant", "blue whale"):
    kg, T = species[name]; N = N_H * kg / 70
    for extra in (0, 1, 2, 4, 8):       # extra TP53 copies, all functional
        print(f"  {name}: +{extra} TP53 copies -> risk {risk(N,u_H,T,2+extra):.3g}")
    for a in (0.0, 0.2, 0.4, 0.6):      # fraction of hit cells culled by apoptosis
        print(f"  {name}: culling {a:.0%} -> risk {risk(N,u_H*(1-a),T):.3g}")
# Monte Carlo check of the per-cell formula (seeded)
rng = np.random.default_rng(25)
u_mc, hits, n = 0.05, 5, 2_000_000
times = rng.exponential(1 / u_mc, size=(n, hits)).max(axis=1)
print(f"MC check: sim {np.mean(times <= 40):.5f} vs formula {cell_p(u_mc, 40, hits):.5f}")
The calibrated rate came out at 1.62 × 10⁻⁴ per event per cell per year. A Monte Carlo check of the per-cell formula (two million simulated cells, fixed seed) gave 0.48274 against an exact value of 0.48332, so the arithmetic holds. The main results:
| Species | At-risk cells (model) | Risk at human mutation rate | Risk if rate scales as 1/lifespan | Rate multiplier needed for 30% risk |
|---|---|---|---|---|
| Mouse | 3.6 × 10⁵ | about 10−11 | 0.013% | 134 |
| Human | 1.0 × 10⁹ | 30% (calibrated) | 30% | 1.00 |
| Elephant | 5.7 × 10¹⁰ | 99.9% | about 100% | 0.546 |
| Blue whale | 1.4 × 10¹² | about 100% | about 100% | 0.207 |
Then the two interventions. Adding functional TP53 copies means a cell needs more hits; culling means a fraction of newly hit cells die by apoptosis before they can carry the mutation forward, which in this model is the same as lowering the effective rate.
| Change | Elephant risk | Blue whale risk |
|---|---|---|
| None | 99.9% | about 100% |
| +1 TP53 copy | 7.3% | about 100% |
| +2 TP53 copies | 0.080% | 17.5% |
| +4 TP53 copies | 9 × 10⁻⁸ | 0.004% |
| Cull 40% of hit cells | 43.5% | about 100% |
| Cull 60% of hit cells | 7.3% | about 100% |
I also varied the total number of hits from three to seven. The rate cut a blue whale needs to match human risk ranged from about 13-fold (three hits) to about 3-fold (seven hits); for the elephant it ranged from about 3-fold to about 1.5-fold. One extra fully functional TP53 copy lowered elephant risk to between 0.6 and 16 percent across those settings.
What the model shows, and what it does not
The useful lesson is about scale. Because a cancer needs several hits, risk climbs with roughly the fifth power of the per-event rate in this setup, while it climbs only linearly with cell number. A 1,400-fold increase in cells can therefore be cancelled by a roughly five-fold drop in mutation rate. Even an elephant, with 57 times a human’s cells, would be back at human risk with a rate about 45 percent lower. The paradox, in other words, demands less biological magic than it first appears to.
Extra suppressor copies are even more potent. In the model one extra copy takes an elephant from near-certain cancer to about 7 percent risk, and two copies push it far below human levels. Twenty copies, if all were fully functional, would be overkill by many orders of magnitude. That points to an honest reading of the elephant data: most of the retrogenes probably do not act as independent full-strength tumor suppressors, or their benefit lies somewhere the model does not capture, such as faster apoptosis rather than an extra hit.
The mouse row is a warning. Even with a mutation rate tied inversely to lifespan, the model gives a mouse almost no cancer, which contradicts the familiar fact that laboratory mice develop tumors readily. Something else must differ: mice may need fewer hits, have more cells at risk per gram, or carry different tissue dynamics. Small animals expose the model’s limits as much as large ones.
The limits matter as much. The model has no clonal expansion, so a cell that picks up one driver does not multiply and make later hits likelier, which is how real tumors progress. It treats all cells as equally at risk, ignores the immune system, ignores tumor growth time, and uses invented body masses and cell counts. Its numbers say nothing about real elephants. They say only how strongly each lever can move risk under one common set of textbook assumptions.
The author’s reading, and studies that would settle it
What follows is my opinion, not an established finding. I read Peto’s paradox as several partial answers stacked together rather than one missing mechanism. The arithmetic says modest changes in per-cell risk are enough. The mutation-rate data show that long-lived species really do have slower clocks. The elephant work shows that at least one lineage also added specific defenses. Different giants probably reached the same outcome by different routes, which is what one would expect from repeated, independent evolution of large size. The same scaling logic surfaces in other places where size and aging interact, such as the finding that big dog breeds age faster on epigenetic clocks, a within-species pattern that runs opposite to the across-species one.
Specific tests that could move the field:
- Measure somatic mutation rates in whales. If a blue whale’s per-year rate in a dividing tissue is not at least several-fold below a human’s (as the simple model implies it should be under a five-hit assumption), mutation rate alone cannot explain whale resistance and some other defense must exist.
- Count at-risk stem cells, not body mass. Estimates of stem cell numbers and division rates in a few tissues across mice, humans and large mammals would show whether cell-at-risk counts scale linearly with mass. Sublinear scaling would shrink the paradox before any genetic explanation is needed.
- Test retrogene function one copy at a time. Knocking individual elephant TP53 retrogenes out of cultured elephant cells, or adding them to human or mouse cells, would show whether they add hits, speed apoptosis, or do little. The model predicts that if even one or two act as full extra hits, the size half of the paradox is solved for elephants.
- Look for convergent defenses in whales. If giant whale lineages show independent expansions or accelerated evolution in DNA repair and tumor suppressor pathways, convergence is supported. If they show none and still have unremarkable mutation rates, the field is missing something.
- Extend necropsy-based cancer data to wild and stranded animals. A standardized survey of large wild mammals would test whether the zoo pattern holds outside zoos.
For background on measuring biological age, see this site’s explainer on epigenetic clocks and longevity trials.
Common questions
Do elephants never get cancer?
They do get cancer, just less than their size would predict. A University of Chicago press release on the 2018 LIF6 study stated that less than five percent of captive elephants die of cancer, compared with about 17 percent of humans. Those figures come from the press release, not from a paper I could read directly.
Is Peto’s paradox actually a paradox?
Only under a naive model in which risk scales linearly with cell number and time and nothing else changes. Evolution is free to change everything else, so the real puzzle is which mechanisms did the work, not whether it can be done.
Could extra p53 copies help humans?
That is an open research direction, not a therapy. More p53 activity is not obviously better, because by design it raises the rate at which damaged cells die, and the costs of that in a human body are unknown. The elephant results are a lead for laboratory work, not something a person can act on.
Why do mice get so much cancer if they have so few cells?
Their short lives come with fast mutation clocks, as Cagan and colleagues found, and they may need fewer steps for a cell to become malignant. The simple model in this article underpredicts mouse cancer badly, which shows that size and lifespan alone do not capture small-animal cancer either.
Further reading
- The Cheating Cell: How Evolution Helps Us Understand and Treat Cancer by Athena Aktipis. A book-length treatment of cancer as an evolutionary problem, including why large animals resist it. See it on Amazon (affiliate link)
As an Amazon Associate I earn from qualifying purchases. A commission may be earned if you buy through this link, at no extra cost to you.
References
- Cagan, A., Baez-Ortega, A., Brzozowska, N., … Martincorena, I. (2022). Somatic mutation rates scale with lifespan across mammals. Nature, 604(7906), 517–524. https://doi.org/10.1038/s41586-022-04618-z
- Vincze, O., Colchero, F., Lemaître, J.-F., … Giraudeau, M. (2022). Cancer risk across mammals. Nature, 601, 263–267. https://www.nature.com/articles/s41586-021-04224-5
- Sulak, M., Fong, L., Mika, K., Chigurupati, S., Yon, L., Mongan, N. P., Emes, R. D., & Lynch, V. J. (2015). TP53 copy number expansion correlates with the evolution of increased body size and an enhanced DNA damage response in elephants. bioRxiv 10.1101/028522 (preprint). https://www.biorxiv.org/content/early/2015/11/24/028522
- Vazquez, J. M., Sulak, M., Chigurupati, S., & Lynch, V. J. (2018). A zombie LIF gene in elephants is upregulated by TP53 to induce apoptosis in response to DNA damage. Cell Reports, 24(7), 1765–1776. https://doi.org/10.1016/j.celrep.2018.07.042
- Nagy, J. D., Victor, E. M., & Cropper, J. H. (2007). Why don’t all whales have cancer? A novel hypothesis resolving Peto’s paradox. Integrative and Comparative Biology (volume and pages not confirmed).
- University of Chicago Medical Center (2018). Zombie gene protects against cancer in elephants [press release via Newswise]. https://www.newswise.com/articles/zombie-gene-protects-against-cancer-in-elephants
- Wellcome Sanger Institute (2022). Mutations across animal kingdom shed new light on ageing [news release]. https://www.sanger.ac.uk/news_item/mutations-across-animal-kingdom-shed-new-light-on-ageing/